Scotch-Irish vs Immigrants from Iraq Currently Married
COMPARE
Scotch-Irish
Immigrants from Iraq
Currently Married
Currently Married Comparison
Scotch-Irish
Immigrants from Iraq
48.7%
CURRENTLY MARRIED
99.3/ 100
METRIC RATING
43rd/ 347
METRIC RANK
47.3%
CURRENTLY MARRIED
82.8/ 100
METRIC RATING
130th/ 347
METRIC RANK
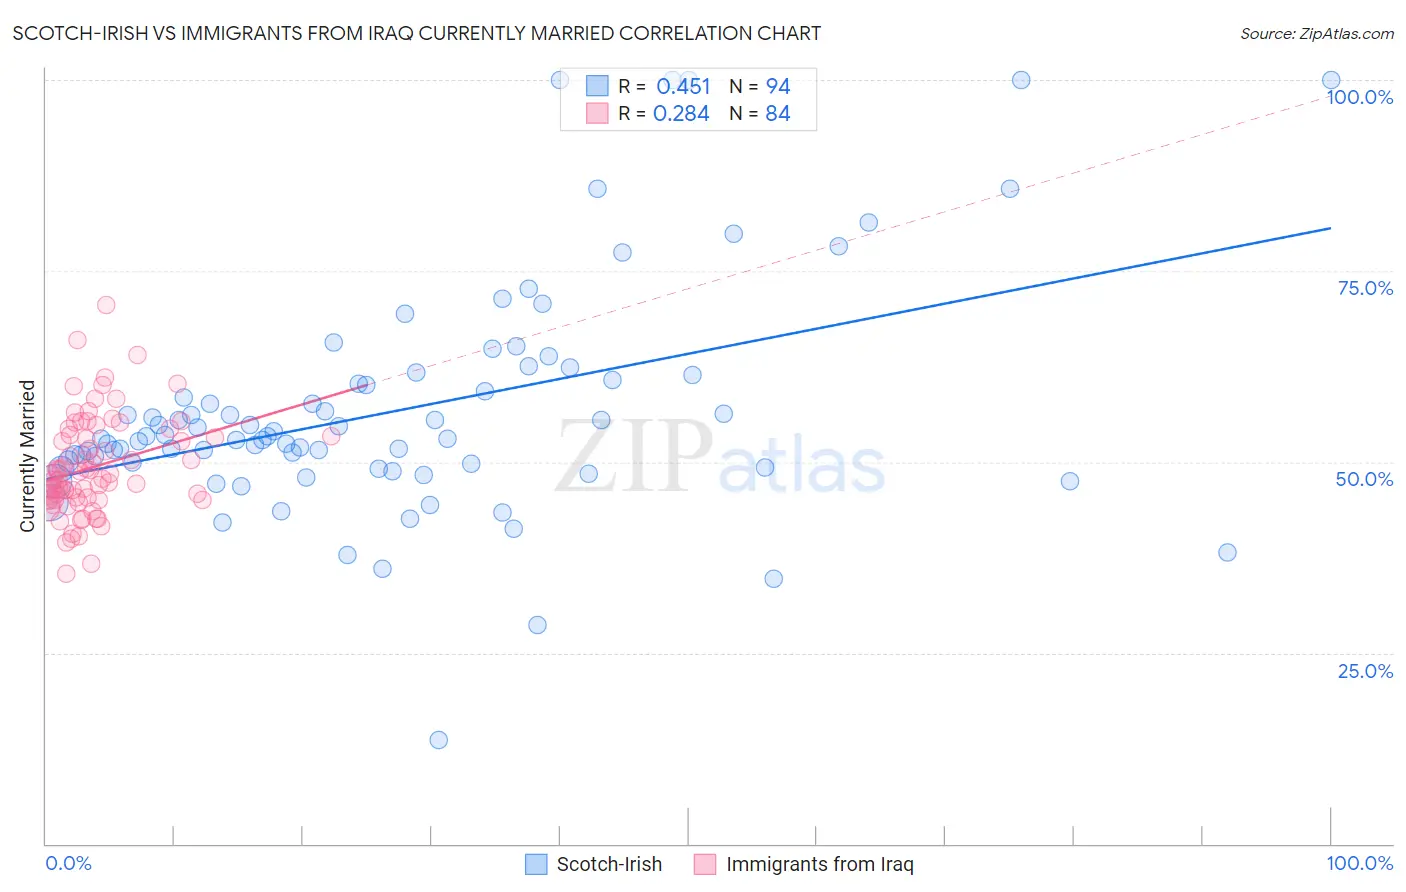
Scotch-Irish vs Immigrants from Iraq Currently Married Correlation Chart
The statistical analysis conducted on geographies consisting of 548,698,308 people shows a moderate positive correlation between the proportion of Scotch-Irish and percentage of population currently married in the United States with a correlation coefficient (R) of 0.451 and weighted average of 48.7%. Similarly, the statistical analysis conducted on geographies consisting of 194,780,853 people shows a weak positive correlation between the proportion of Immigrants from Iraq and percentage of population currently married in the United States with a correlation coefficient (R) of 0.284 and weighted average of 47.3%, a difference of 3.1%.
Currently Married Correlation Summary
| Measurement | Scotch-Irish | Immigrants from Iraq |
| Minimum | 13.6% | 35.4% |
| Maximum | 100.0% | 70.5% |
| Range | 86.4% | 35.1% |
| Mean | 56.8% | 49.3% |
| Median | 53.2% | 48.1% |
| Interquartile 25% (IQ1) | 49.2% | 45.2% |
| Interquartile 75% (IQ3) | 60.7% | 53.5% |
| Interquartile Range (IQR) | 11.5% | 8.3% |
| Standard Deviation (Sample) | 15.2% | 6.5% |
| Standard Deviation (Population) | 15.1% | 6.4% |
Similar Demographics by Currently Married
Demographics Similar to Scotch-Irish by Currently Married
In terms of currently married, the demographic groups most similar to Scotch-Irish are Finnish (48.8%, a difference of 0.010%), Immigrants from North America (48.7%, a difference of 0.030%), Greek (48.8%, a difference of 0.050%), Belgian (48.7%, a difference of 0.060%), and Immigrants from Canada (48.8%, a difference of 0.070%).
| Demographics | Rating | Rank | Currently Married |
| Italians | 99.4 /100 | #36 | Exceptional 48.8% |
| Hungarians | 99.4 /100 | #37 | Exceptional 48.8% |
| Czechoslovakians | 99.4 /100 | #38 | Exceptional 48.8% |
| British | 99.4 /100 | #39 | Exceptional 48.8% |
| Immigrants | Canada | 99.4 /100 | #40 | Exceptional 48.8% |
| Greeks | 99.3 /100 | #41 | Exceptional 48.8% |
| Finns | 99.3 /100 | #42 | Exceptional 48.8% |
| Scotch-Irish | 99.3 /100 | #43 | Exceptional 48.7% |
| Immigrants | North America | 99.3 /100 | #44 | Exceptional 48.7% |
| Belgians | 99.3 /100 | #45 | Exceptional 48.7% |
| Immigrants | Iran | 99.2 /100 | #46 | Exceptional 48.7% |
| Northern Europeans | 99.2 /100 | #47 | Exceptional 48.7% |
| Austrians | 99.2 /100 | #48 | Exceptional 48.7% |
| Bhutanese | 99.1 /100 | #49 | Exceptional 48.6% |
| Iranians | 99.0 /100 | #50 | Exceptional 48.6% |
Demographics Similar to Immigrants from Iraq by Currently Married
In terms of currently married, the demographic groups most similar to Immigrants from Iraq are Icelander (47.3%, a difference of 0.020%), Sri Lankan (47.3%, a difference of 0.030%), Afghan (47.3%, a difference of 0.060%), Portuguese (47.3%, a difference of 0.090%), and Immigrants from Malaysia (47.3%, a difference of 0.10%).
| Demographics | Rating | Rank | Currently Married |
| Immigrants | Kazakhstan | 87.2 /100 | #123 | Excellent 47.4% |
| Laotians | 86.6 /100 | #124 | Excellent 47.4% |
| Okinawans | 85.3 /100 | #125 | Excellent 47.4% |
| Immigrants | Jordan | 84.9 /100 | #126 | Excellent 47.4% |
| New Zealanders | 84.9 /100 | #127 | Excellent 47.4% |
| Portuguese | 84.2 /100 | #128 | Excellent 47.3% |
| Sri Lankans | 83.2 /100 | #129 | Excellent 47.3% |
| Immigrants | Iraq | 82.8 /100 | #130 | Excellent 47.3% |
| Icelanders | 82.4 /100 | #131 | Excellent 47.3% |
| Afghans | 81.8 /100 | #132 | Excellent 47.3% |
| Immigrants | Malaysia | 81.1 /100 | #133 | Excellent 47.3% |
| Immigrants | Australia | 81.1 /100 | #134 | Excellent 47.3% |
| Immigrants | Norway | 79.7 /100 | #135 | Good 47.2% |
| Immigrants | Vietnam | 78.2 /100 | #136 | Good 47.2% |
| Paraguayans | 77.8 /100 | #137 | Good 47.2% |