White/Caucasian vs Immigrants from Guyana Married-couple Households
COMPARE
White/Caucasian
Immigrants from Guyana
Married-couple Households
Married-couple Households Comparison
Whites/Caucasians
Immigrants from Guyana
48.6%
MARRIED-COUPLE HOUSEHOLDS
99.3/ 100
METRIC RATING
53rd/ 347
METRIC RANK
41.6%
MARRIED-COUPLE HOUSEHOLDS
0.0/ 100
METRIC RATING
304th/ 347
METRIC RANK
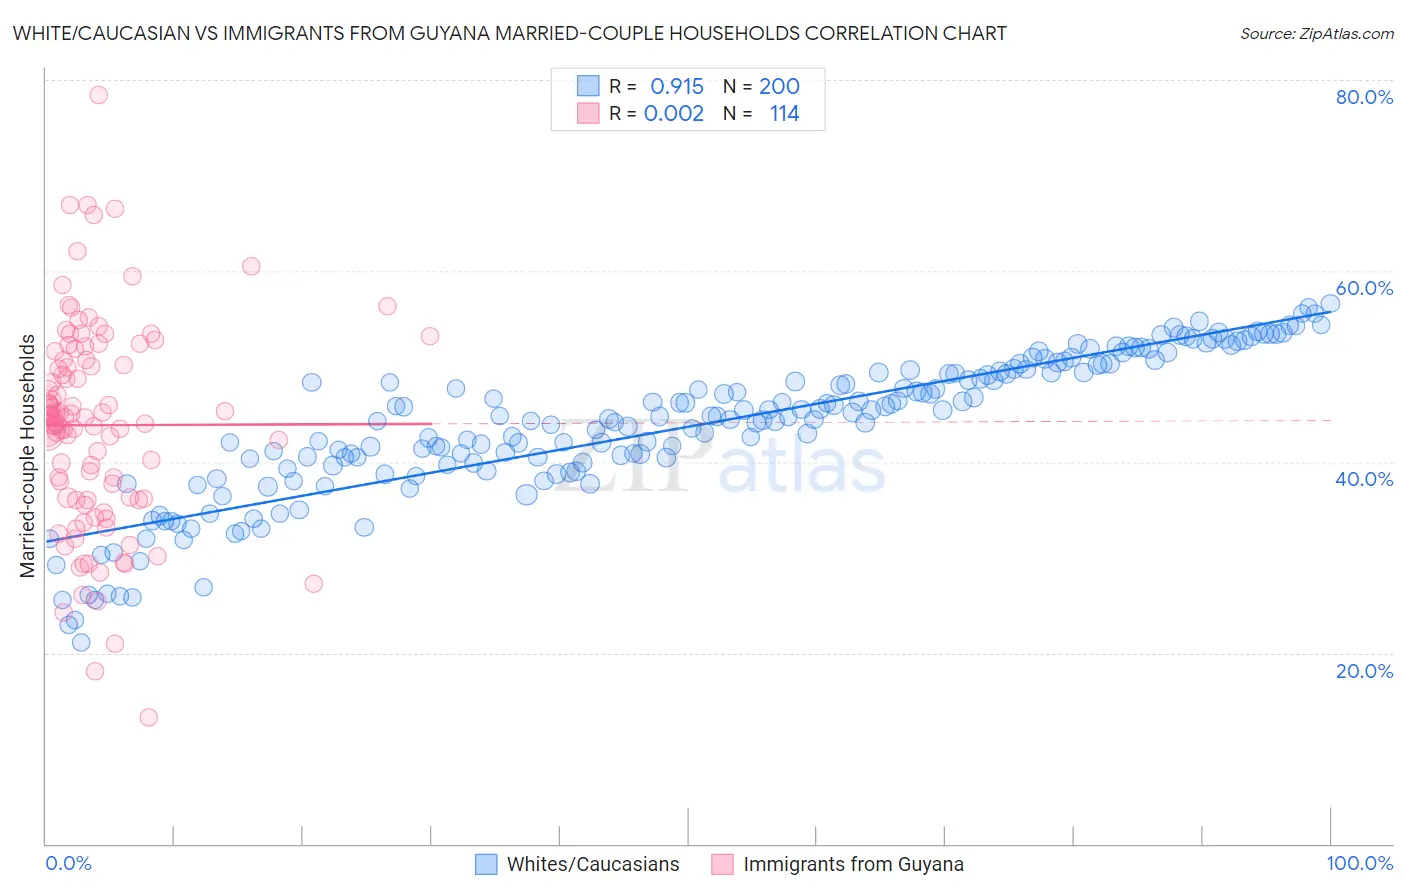
White/Caucasian vs Immigrants from Guyana Married-couple Households Correlation Chart
The statistical analysis conducted on geographies consisting of 584,446,741 people shows a near-perfect positive correlation between the proportion of Whites/Caucasians and percentage of married-couple family households in the United States with a correlation coefficient (R) of 0.915 and weighted average of 48.6%. Similarly, the statistical analysis conducted on geographies consisting of 183,688,079 people shows no correlation between the proportion of Immigrants from Guyana and percentage of married-couple family households in the United States with a correlation coefficient (R) of 0.002 and weighted average of 41.6%, a difference of 16.9%.
Married-couple Households Correlation Summary
| Measurement | White/Caucasian | Immigrants from Guyana |
| Minimum | 21.1% | 13.3% |
| Maximum | 56.5% | 78.4% |
| Range | 35.4% | 65.2% |
| Mean | 43.7% | 43.9% |
| Median | 44.7% | 44.6% |
| Interquartile 25% (IQ1) | 39.7% | 36.2% |
| Interquartile 75% (IQ3) | 49.4% | 50.7% |
| Interquartile Range (IQR) | 9.8% | 14.5% |
| Standard Deviation (Sample) | 7.6% | 10.9% |
| Standard Deviation (Population) | 7.6% | 10.8% |
Similar Demographics by Married-couple Households
Demographics Similar to Whites/Caucasians by Married-couple Households
In terms of married-couple households, the demographic groups most similar to Whites/Caucasians are Immigrants from Lithuania (48.6%, a difference of 0.010%), Austrian (48.6%, a difference of 0.010%), Immigrants from Northern Europe (48.6%, a difference of 0.010%), Irish (48.6%, a difference of 0.050%), and Eastern European (48.6%, a difference of 0.090%).
| Demographics | Rating | Rank | Married-couple Households |
| Tsimshian | 99.5 /100 | #46 | Exceptional 48.7% |
| British | 99.5 /100 | #47 | Exceptional 48.7% |
| Indians (Asian) | 99.4 /100 | #48 | Exceptional 48.7% |
| Immigrants | Sri Lanka | 99.4 /100 | #49 | Exceptional 48.7% |
| Samoans | 99.4 /100 | #50 | Exceptional 48.7% |
| Eastern Europeans | 99.3 /100 | #51 | Exceptional 48.6% |
| Irish | 99.3 /100 | #52 | Exceptional 48.6% |
| Whites/Caucasians | 99.3 /100 | #53 | Exceptional 48.6% |
| Immigrants | Lithuania | 99.3 /100 | #54 | Exceptional 48.6% |
| Austrians | 99.3 /100 | #55 | Exceptional 48.6% |
| Immigrants | Northern Europe | 99.3 /100 | #56 | Exceptional 48.6% |
| Poles | 99.2 /100 | #57 | Exceptional 48.5% |
| Immigrants | Indonesia | 99.2 /100 | #58 | Exceptional 48.5% |
| Czechoslovakians | 99.2 /100 | #59 | Exceptional 48.5% |
| Croatians | 99.1 /100 | #60 | Exceptional 48.5% |
Demographics Similar to Immigrants from Guyana by Married-couple Households
In terms of married-couple households, the demographic groups most similar to Immigrants from Guyana are Subsaharan African (41.6%, a difference of 0.11%), Sioux (41.5%, a difference of 0.11%), Immigrants from Honduras (41.6%, a difference of 0.12%), Immigrants from Bahamas (41.7%, a difference of 0.29%), and Guyanese (41.4%, a difference of 0.48%).
| Demographics | Rating | Rank | Married-couple Households |
| Arapaho | 0.0 /100 | #297 | Tragic 41.8% |
| Immigrants | Middle Africa | 0.0 /100 | #298 | Tragic 41.8% |
| Immigrants | Ghana | 0.0 /100 | #299 | Tragic 41.8% |
| Immigrants | Belize | 0.0 /100 | #300 | Tragic 41.8% |
| Immigrants | Bahamas | 0.0 /100 | #301 | Tragic 41.7% |
| Immigrants | Honduras | 0.0 /100 | #302 | Tragic 41.6% |
| Sub-Saharan Africans | 0.0 /100 | #303 | Tragic 41.6% |
| Immigrants | Guyana | 0.0 /100 | #304 | Tragic 41.6% |
| Sioux | 0.0 /100 | #305 | Tragic 41.5% |
| Guyanese | 0.0 /100 | #306 | Tragic 41.4% |
| Immigrants | Western Africa | 0.0 /100 | #307 | Tragic 41.4% |
| Crow | 0.0 /100 | #308 | Tragic 41.4% |
| Immigrants | Trinidad and Tobago | 0.0 /100 | #309 | Tragic 41.2% |
| Haitians | 0.0 /100 | #310 | Tragic 41.2% |
| Colville | 0.0 /100 | #311 | Tragic 41.0% |