White/Caucasian vs Immigrants from Guyana Single Mother Households
COMPARE
White/Caucasian
Immigrants from Guyana
Single Mother Households
Single Mother Households Comparison
Whites/Caucasians
Immigrants from Guyana
6.1%
SINGLE MOTHER HOUSEHOLDS
76.5/ 100
METRIC RATING
155th/ 347
METRIC RANK
7.6%
SINGLE MOTHER HOUSEHOLDS
0.1/ 100
METRIC RATING
274th/ 347
METRIC RANK
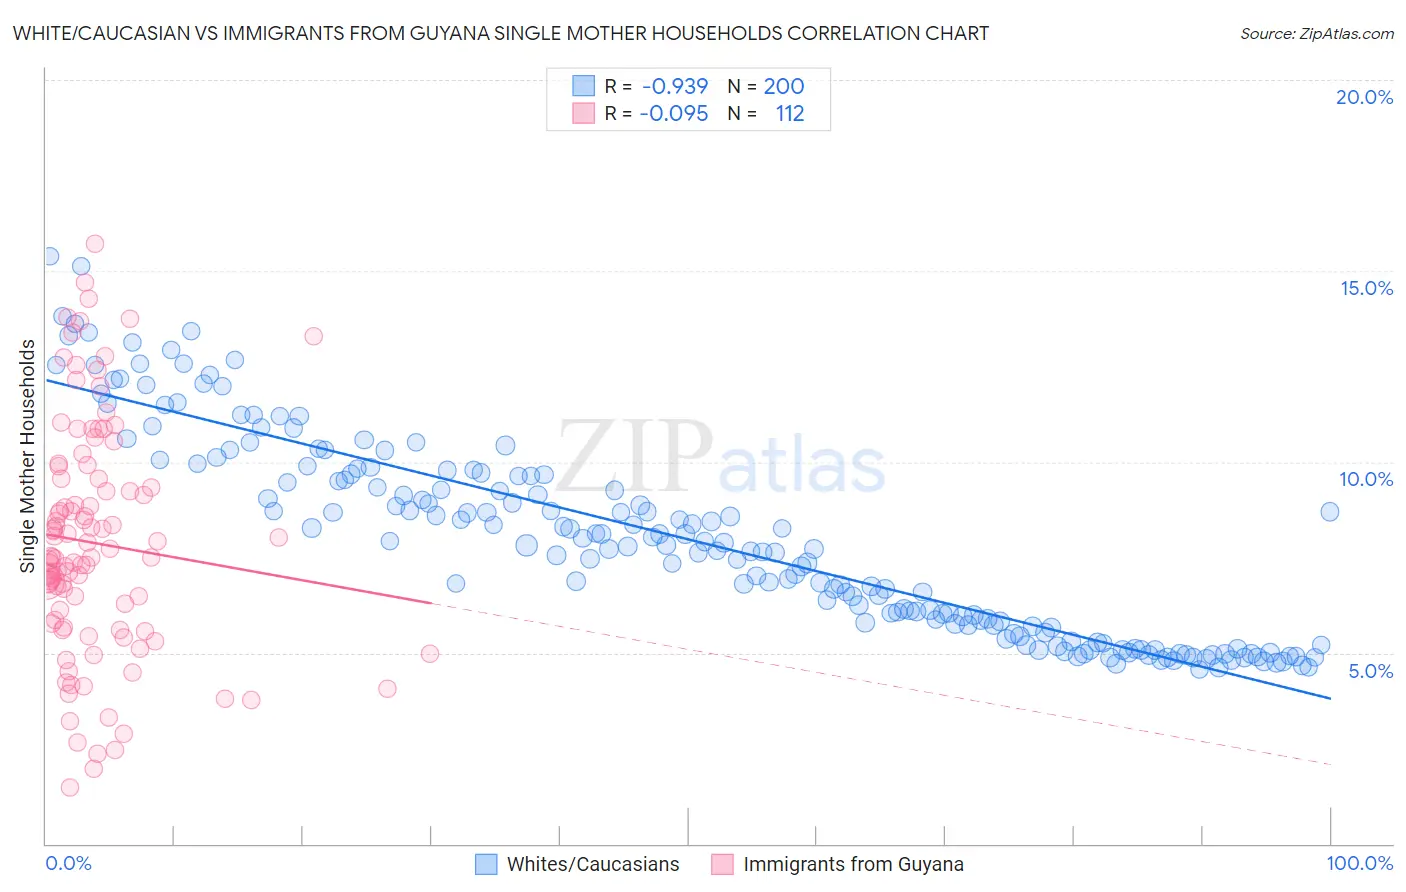
White/Caucasian vs Immigrants from Guyana Single Mother Households Correlation Chart
The statistical analysis conducted on geographies consisting of 577,516,213 people shows a near-perfect negative correlation between the proportion of Whites/Caucasians and percentage of single mother households in the United States with a correlation coefficient (R) of -0.939 and weighted average of 6.1%. Similarly, the statistical analysis conducted on geographies consisting of 183,513,161 people shows a slight negative correlation between the proportion of Immigrants from Guyana and percentage of single mother households in the United States with a correlation coefficient (R) of -0.095 and weighted average of 7.6%, a difference of 23.8%.
Single Mother Households Correlation Summary
| Measurement | White/Caucasian | Immigrants from Guyana |
| Minimum | 4.6% | 1.5% |
| Maximum | 15.4% | 15.7% |
| Range | 10.8% | 14.2% |
| Mean | 8.0% | 7.9% |
| Median | 7.8% | 7.5% |
| Interquartile 25% (IQ1) | 5.7% | 5.7% |
| Interquartile 75% (IQ3) | 9.7% | 9.6% |
| Interquartile Range (IQR) | 4.0% | 3.8% |
| Standard Deviation (Sample) | 2.6% | 3.0% |
| Standard Deviation (Population) | 2.6% | 3.0% |
Similar Demographics by Single Mother Households
Demographics Similar to Whites/Caucasians by Single Mother Households
In terms of single mother households, the demographic groups most similar to Whites/Caucasians are Native Hawaiian (6.1%, a difference of 0.23%), Immigrants from Philippines (6.1%, a difference of 0.33%), Chilean (6.1%, a difference of 0.34%), Immigrants from Brazil (6.1%, a difference of 0.40%), and Pakistani (6.1%, a difference of 0.44%).
| Demographics | Rating | Rank | Single Mother Households |
| Scotch-Irish | 82.0 /100 | #148 | Excellent 6.0% |
| Immigrants | Albania | 81.5 /100 | #149 | Excellent 6.1% |
| Zimbabweans | 80.7 /100 | #150 | Excellent 6.1% |
| Immigrants | Southern Europe | 80.5 /100 | #151 | Excellent 6.1% |
| Pakistanis | 79.2 /100 | #152 | Good 6.1% |
| Immigrants | Brazil | 78.9 /100 | #153 | Good 6.1% |
| Immigrants | Philippines | 78.5 /100 | #154 | Good 6.1% |
| Whites/Caucasians | 76.5 /100 | #155 | Good 6.1% |
| Native Hawaiians | 75.0 /100 | #156 | Good 6.1% |
| Chileans | 74.2 /100 | #157 | Good 6.1% |
| Celtics | 73.3 /100 | #158 | Good 6.1% |
| Yugoslavians | 73.1 /100 | #159 | Good 6.1% |
| Iraqis | 73.0 /100 | #160 | Good 6.1% |
| Immigrants | Germany | 72.4 /100 | #161 | Good 6.1% |
| Immigrants | Zimbabwe | 69.9 /100 | #162 | Good 6.2% |
Demographics Similar to Immigrants from Guyana by Single Mother Households
In terms of single mother households, the demographic groups most similar to Immigrants from Guyana are Belizean (7.6%, a difference of 0.040%), Central American Indian (7.6%, a difference of 0.10%), Salvadoran (7.5%, a difference of 0.36%), Immigrants from the Azores (7.5%, a difference of 0.36%), and Immigrants from Cuba (7.5%, a difference of 0.45%).
| Demographics | Rating | Rank | Single Mother Households |
| Blackfeet | 0.1 /100 | #267 | Tragic 7.5% |
| Indonesians | 0.1 /100 | #268 | Tragic 7.5% |
| Somalis | 0.1 /100 | #269 | Tragic 7.5% |
| Immigrants | Cuba | 0.1 /100 | #270 | Tragic 7.5% |
| Salvadorans | 0.1 /100 | #271 | Tragic 7.5% |
| Immigrants | Azores | 0.1 /100 | #272 | Tragic 7.5% |
| Belizeans | 0.1 /100 | #273 | Tragic 7.6% |
| Immigrants | Guyana | 0.1 /100 | #274 | Tragic 7.6% |
| Central American Indians | 0.1 /100 | #275 | Tragic 7.6% |
| Guyanese | 0.1 /100 | #276 | Tragic 7.6% |
| Immigrants | Trinidad and Tobago | 0.1 /100 | #277 | Tragic 7.6% |
| Central Americans | 0.1 /100 | #278 | Tragic 7.6% |
| Immigrants | El Salvador | 0.0 /100 | #279 | Tragic 7.6% |
| Immigrants | Sierra Leone | 0.0 /100 | #280 | Tragic 7.7% |
| Immigrants | Laos | 0.0 /100 | #281 | Tragic 7.7% |