White/Caucasian vs Serbian Married-couple Households
COMPARE
White/Caucasian
Serbian
Married-couple Households
Married-couple Households Comparison
Whites/Caucasians
Serbians
48.6%
MARRIED-COUPLE HOUSEHOLDS
99.3/ 100
METRIC RATING
53rd/ 347
METRIC RANK
47.0%
MARRIED-COUPLE HOUSEHOLDS
76.3/ 100
METRIC RATING
152nd/ 347
METRIC RANK
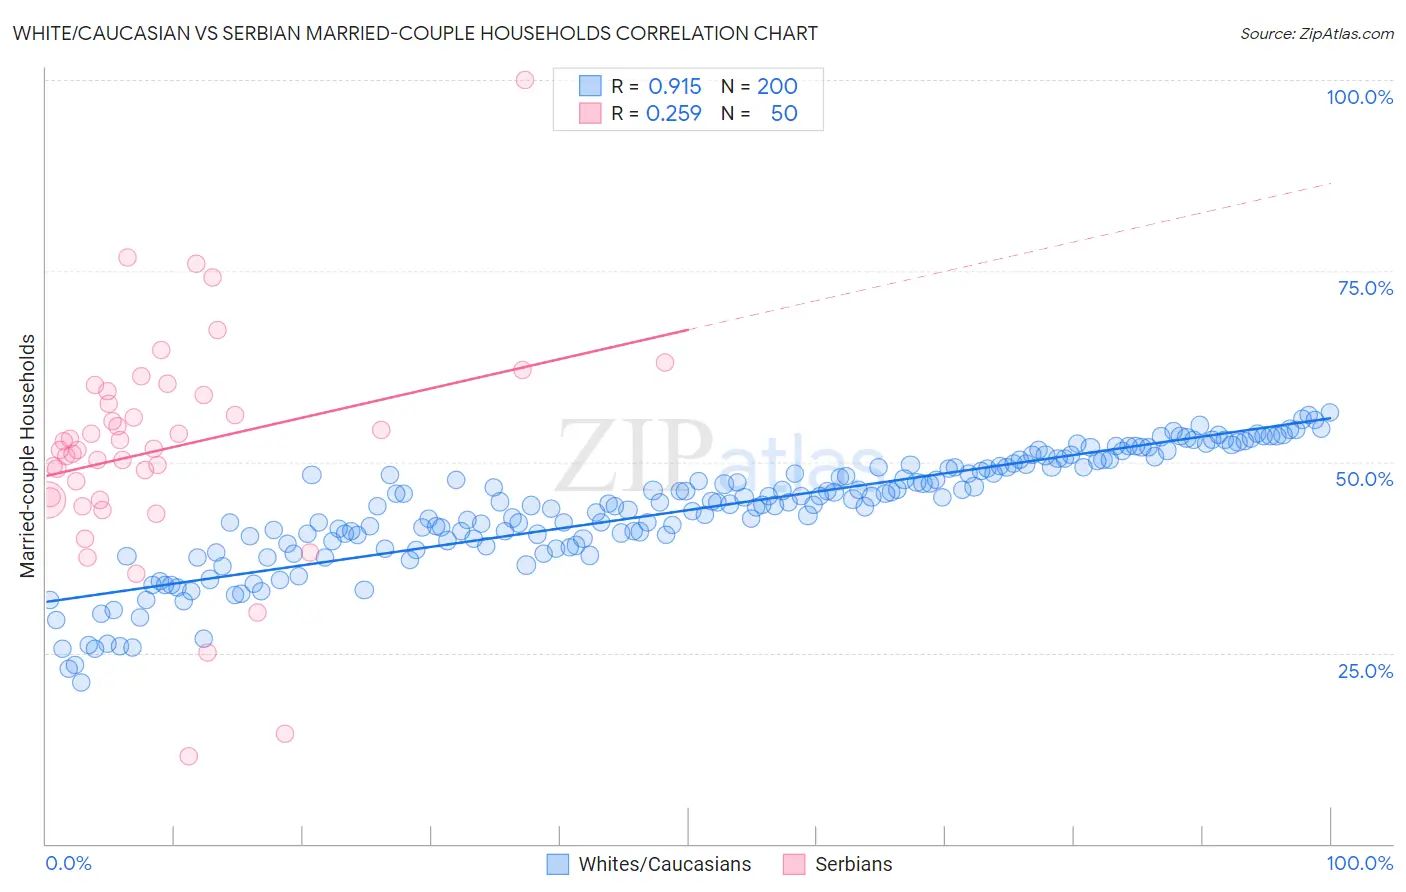
White/Caucasian vs Serbian Married-couple Households Correlation Chart
The statistical analysis conducted on geographies consisting of 584,446,741 people shows a near-perfect positive correlation between the proportion of Whites/Caucasians and percentage of married-couple family households in the United States with a correlation coefficient (R) of 0.915 and weighted average of 48.6%. Similarly, the statistical analysis conducted on geographies consisting of 267,530,139 people shows a weak positive correlation between the proportion of Serbians and percentage of married-couple family households in the United States with a correlation coefficient (R) of 0.259 and weighted average of 47.0%, a difference of 3.5%.
Married-couple Households Correlation Summary
| Measurement | White/Caucasian | Serbian |
| Minimum | 21.1% | 11.4% |
| Maximum | 56.5% | 100.0% |
| Range | 35.4% | 88.6% |
| Mean | 43.7% | 51.7% |
| Median | 44.7% | 51.7% |
| Interquartile 25% (IQ1) | 39.7% | 45.0% |
| Interquartile 75% (IQ3) | 49.4% | 58.7% |
| Interquartile Range (IQR) | 9.8% | 13.7% |
| Standard Deviation (Sample) | 7.6% | 14.6% |
| Standard Deviation (Population) | 7.6% | 14.5% |
Similar Demographics by Married-couple Households
Demographics Similar to Whites/Caucasians by Married-couple Households
In terms of married-couple households, the demographic groups most similar to Whites/Caucasians are Immigrants from Lithuania (48.6%, a difference of 0.010%), Austrian (48.6%, a difference of 0.010%), Immigrants from Northern Europe (48.6%, a difference of 0.010%), Irish (48.6%, a difference of 0.050%), and Eastern European (48.6%, a difference of 0.090%).
| Demographics | Rating | Rank | Married-couple Households |
| Tsimshian | 99.5 /100 | #46 | Exceptional 48.7% |
| British | 99.5 /100 | #47 | Exceptional 48.7% |
| Indians (Asian) | 99.4 /100 | #48 | Exceptional 48.7% |
| Immigrants | Sri Lanka | 99.4 /100 | #49 | Exceptional 48.7% |
| Samoans | 99.4 /100 | #50 | Exceptional 48.7% |
| Eastern Europeans | 99.3 /100 | #51 | Exceptional 48.6% |
| Irish | 99.3 /100 | #52 | Exceptional 48.6% |
| Whites/Caucasians | 99.3 /100 | #53 | Exceptional 48.6% |
| Immigrants | Lithuania | 99.3 /100 | #54 | Exceptional 48.6% |
| Austrians | 99.3 /100 | #55 | Exceptional 48.6% |
| Immigrants | Northern Europe | 99.3 /100 | #56 | Exceptional 48.6% |
| Poles | 99.2 /100 | #57 | Exceptional 48.5% |
| Immigrants | Indonesia | 99.2 /100 | #58 | Exceptional 48.5% |
| Czechoslovakians | 99.2 /100 | #59 | Exceptional 48.5% |
| Croatians | 99.1 /100 | #60 | Exceptional 48.5% |
Demographics Similar to Serbians by Married-couple Households
In terms of married-couple households, the demographic groups most similar to Serbians are Hmong (47.0%, a difference of 0.010%), Immigrants from Western Asia (46.9%, a difference of 0.010%), Immigrants from Bulgaria (47.0%, a difference of 0.020%), Arab (46.9%, a difference of 0.020%), and Armenian (46.9%, a difference of 0.050%).
| Demographics | Rating | Rank | Married-couple Households |
| Slovenes | 81.7 /100 | #145 | Excellent 47.1% |
| Immigrants | Western Europe | 81.6 /100 | #146 | Excellent 47.1% |
| Immigrants | Syria | 81.6 /100 | #147 | Excellent 47.1% |
| Icelanders | 79.5 /100 | #148 | Good 47.0% |
| Paraguayans | 78.7 /100 | #149 | Good 47.0% |
| Immigrants | Russia | 77.6 /100 | #150 | Good 47.0% |
| Immigrants | Bulgaria | 76.8 /100 | #151 | Good 47.0% |
| Serbians | 76.3 /100 | #152 | Good 47.0% |
| Hmong | 76.2 /100 | #153 | Good 47.0% |
| Immigrants | Western Asia | 76.1 /100 | #154 | Good 46.9% |
| Arabs | 76.0 /100 | #155 | Good 46.9% |
| Armenians | 75.4 /100 | #156 | Good 46.9% |
| Immigrants | Oceania | 74.8 /100 | #157 | Good 46.9% |
| Immigrants | Nonimmigrants | 73.3 /100 | #158 | Good 46.9% |
| Osage | 73.2 /100 | #159 | Good 46.9% |