Ugandan vs Lumbee Child Poverty Under the Age of 5
COMPARE
Ugandan
Lumbee
Child Poverty Under the Age of 5
Child Poverty Under the Age of 5 Comparison
Ugandans
Lumbee
18.0%
CHILD POVERTY UNDER THE AGE OF 5
13.9/ 100
METRIC RATING
201st/ 347
METRIC RANK
33.3%
CHILD POVERTY UNDER THE AGE OF 5
0.0/ 100
METRIC RATING
346th/ 347
METRIC RANK
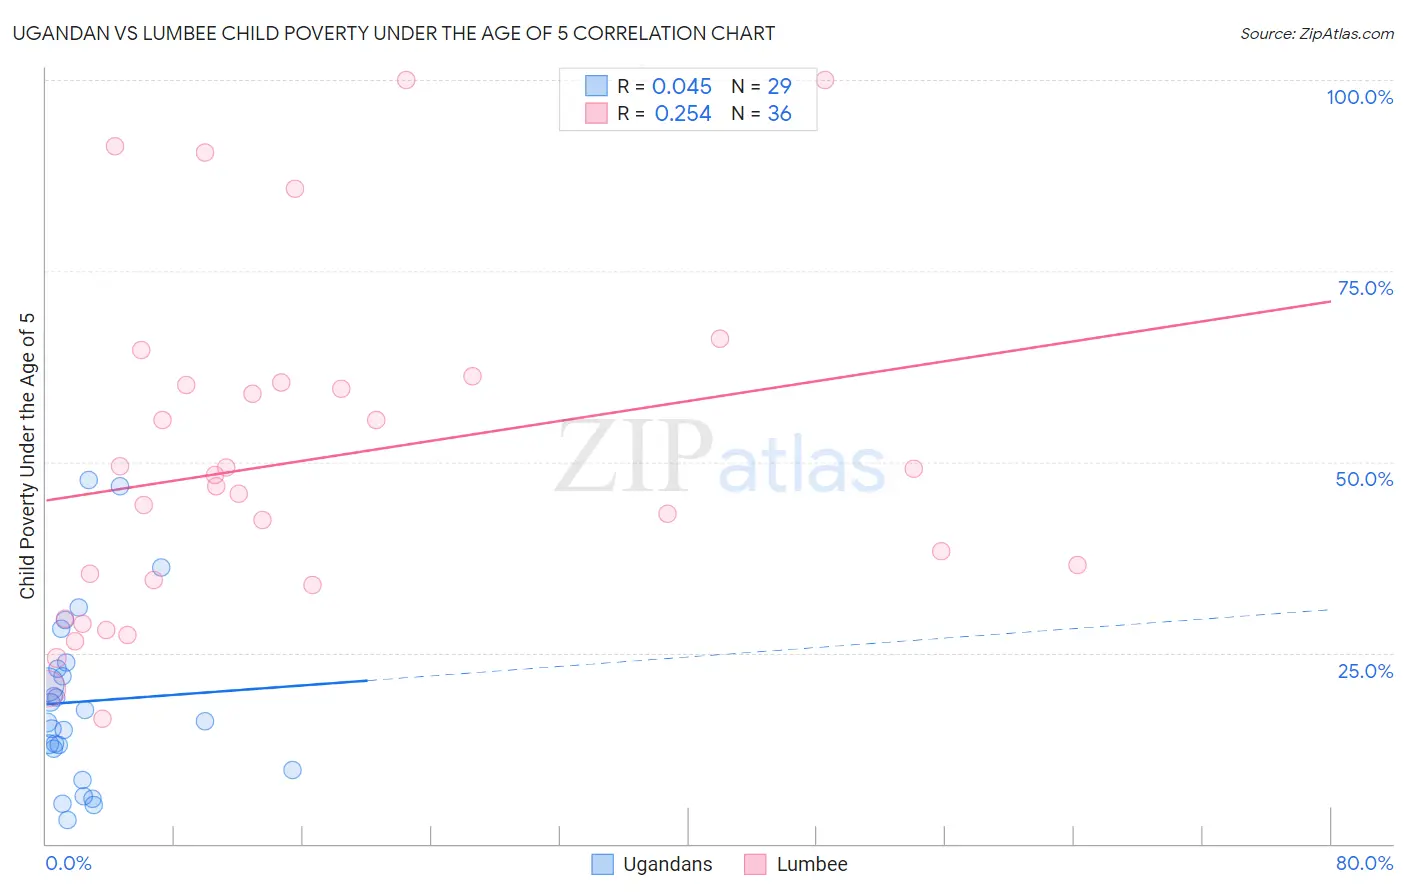
Ugandan vs Lumbee Child Poverty Under the Age of 5 Correlation Chart
The statistical analysis conducted on geographies consisting of 92,908,510 people shows no correlation between the proportion of Ugandans and poverty level among children under the age of 5 in the United States with a correlation coefficient (R) of 0.045 and weighted average of 18.0%. Similarly, the statistical analysis conducted on geographies consisting of 91,145,286 people shows a weak positive correlation between the proportion of Lumbee and poverty level among children under the age of 5 in the United States with a correlation coefficient (R) of 0.254 and weighted average of 33.3%, a difference of 84.6%.
Child Poverty Under the Age of 5 Correlation Summary
| Measurement | Ugandan | Lumbee |
| Minimum | 3.2% | 16.3% |
| Maximum | 47.7% | 100.0% |
| Range | 44.5% | 83.7% |
| Mean | 18.6% | 50.2% |
| Median | 16.0% | 47.5% |
| Interquartile 25% (IQ1) | 11.1% | 34.2% |
| Interquartile 75% (IQ3) | 23.3% | 60.3% |
| Interquartile Range (IQR) | 12.2% | 26.1% |
| Standard Deviation (Sample) | 11.4% | 22.0% |
| Standard Deviation (Population) | 11.2% | 21.7% |
Similar Demographics by Child Poverty Under the Age of 5
Demographics Similar to Ugandans by Child Poverty Under the Age of 5
In terms of child poverty under the age of 5, the demographic groups most similar to Ugandans are Iraqi (18.0%, a difference of 0.010%), Japanese (18.1%, a difference of 0.020%), Immigrants from Cambodia (18.1%, a difference of 0.040%), Immigrants from Eastern Africa (18.1%, a difference of 0.090%), and Spaniard (18.1%, a difference of 0.22%).
| Demographics | Rating | Rank | Child Poverty Under the Age of 5 |
| French Canadians | 24.6 /100 | #194 | Fair 17.7% |
| Sierra Leoneans | 24.1 /100 | #195 | Fair 17.7% |
| Immigrants | Portugal | 22.2 /100 | #196 | Fair 17.8% |
| Immigrants | Kenya | 20.0 /100 | #197 | Fair 17.9% |
| Celtics | 18.3 /100 | #198 | Poor 17.9% |
| Hungarians | 18.3 /100 | #199 | Poor 17.9% |
| Iraqis | 14.0 /100 | #200 | Poor 18.0% |
| Ugandans | 13.9 /100 | #201 | Poor 18.0% |
| Japanese | 13.8 /100 | #202 | Poor 18.1% |
| Immigrants | Cambodia | 13.7 /100 | #203 | Poor 18.1% |
| Immigrants | Eastern Africa | 13.4 /100 | #204 | Poor 18.1% |
| Spaniards | 12.8 /100 | #205 | Poor 18.1% |
| Whites/Caucasians | 12.6 /100 | #206 | Poor 18.1% |
| Immigrants | Immigrants | 9.9 /100 | #207 | Tragic 18.2% |
| Scotch-Irish | 9.8 /100 | #208 | Tragic 18.2% |
Demographics Similar to Lumbee by Child Poverty Under the Age of 5
In terms of child poverty under the age of 5, the demographic groups most similar to Lumbee are Puerto Rican (34.5%, a difference of 3.7%), Navajo (31.6%, a difference of 5.4%), Crow (31.0%, a difference of 7.4%), Yuman (29.5%, a difference of 12.7%), and Tohono O'odham (29.5%, a difference of 12.9%).
| Demographics | Rating | Rank | Child Poverty Under the Age of 5 |
| Natives/Alaskans | 0.0 /100 | #333 | Tragic 25.6% |
| Blacks/African Americans | 0.0 /100 | #334 | Tragic 25.7% |
| Colville | 0.0 /100 | #335 | Tragic 25.7% |
| Sioux | 0.0 /100 | #336 | Tragic 26.9% |
| Pima | 0.0 /100 | #337 | Tragic 27.4% |
| Hopi | 0.0 /100 | #338 | Tragic 27.7% |
| Yup'ik | 0.0 /100 | #339 | Tragic 27.7% |
| Cheyenne | 0.0 /100 | #340 | Tragic 28.3% |
| Immigrants | Yemen | 0.0 /100 | #341 | Tragic 29.3% |
| Tohono O'odham | 0.0 /100 | #342 | Tragic 29.5% |
| Yuman | 0.0 /100 | #343 | Tragic 29.5% |
| Crow | 0.0 /100 | #344 | Tragic 31.0% |
| Navajo | 0.0 /100 | #345 | Tragic 31.6% |
| Lumbee | 0.0 /100 | #346 | Tragic 33.3% |
| Puerto Ricans | 0.0 /100 | #347 | Tragic 34.5% |