Ugandan vs Lumbee Disability
COMPARE
Ugandan
Lumbee
Disability
Disability Comparison
Ugandans
Lumbee
11.4%
DISABILITY
87.9/ 100
METRIC RATING
135th/ 347
METRIC RANK
15.5%
DISABILITY
0.0/ 100
METRIC RATING
341st/ 347
METRIC RANK
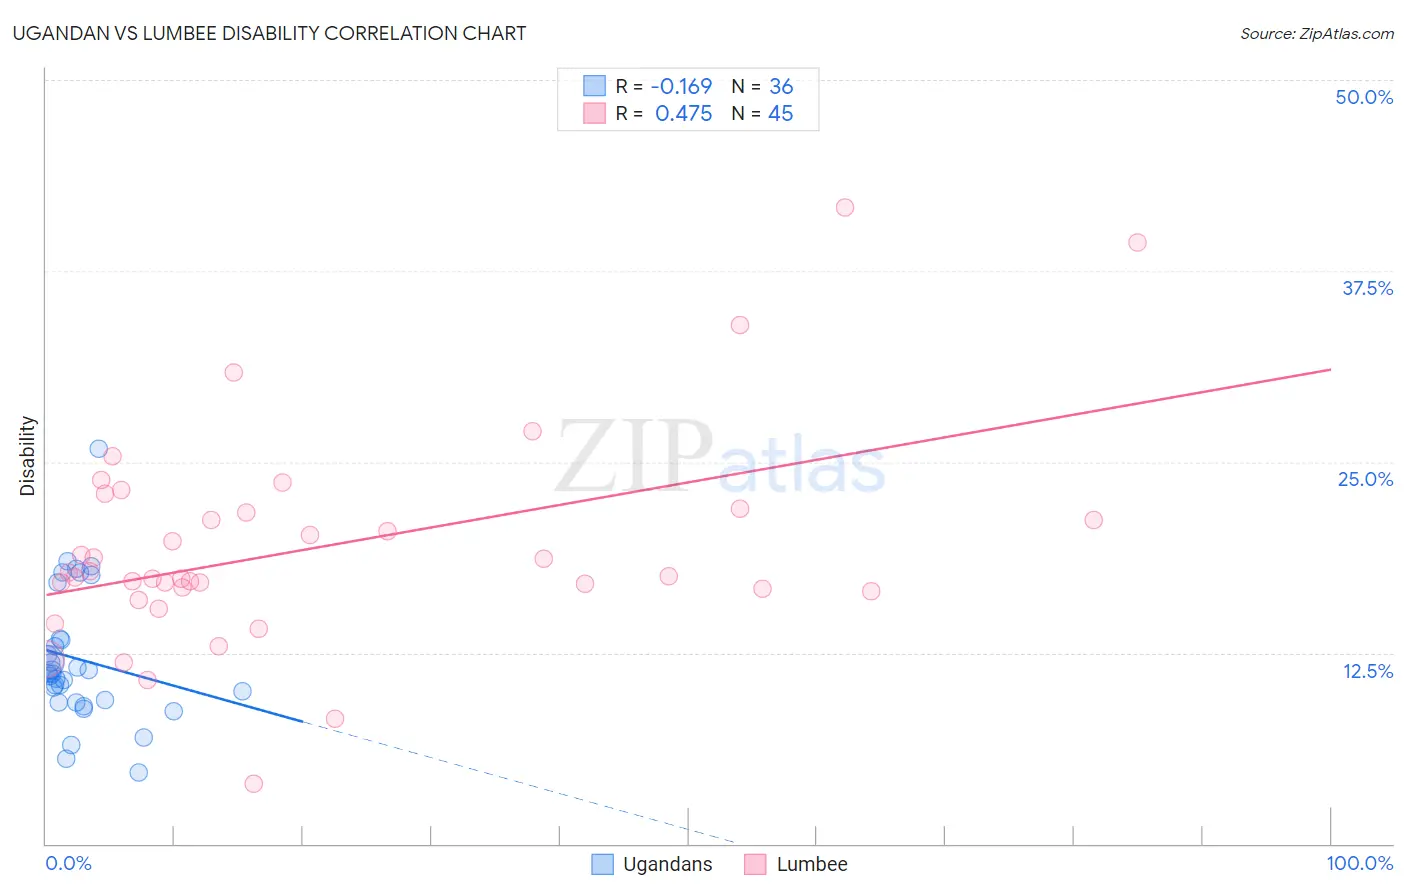
Ugandan vs Lumbee Disability Correlation Chart
The statistical analysis conducted on geographies consisting of 94,018,396 people shows a poor negative correlation between the proportion of Ugandans and percentage of population with a disability in the United States with a correlation coefficient (R) of -0.169 and weighted average of 11.4%. Similarly, the statistical analysis conducted on geographies consisting of 92,289,178 people shows a moderate positive correlation between the proportion of Lumbee and percentage of population with a disability in the United States with a correlation coefficient (R) of 0.475 and weighted average of 15.5%, a difference of 35.7%.
Disability Correlation Summary
| Measurement | Ugandan | Lumbee |
| Minimum | 4.7% | 3.9% |
| Maximum | 25.9% | 41.7% |
| Range | 21.2% | 37.8% |
| Mean | 12.1% | 19.4% |
| Median | 11.1% | 17.5% |
| Interquartile 25% (IQ1) | 9.4% | 16.6% |
| Interquartile 75% (IQ3) | 13.4% | 21.8% |
| Interquartile Range (IQR) | 4.1% | 5.2% |
| Standard Deviation (Sample) | 4.3% | 7.0% |
| Standard Deviation (Population) | 4.3% | 6.9% |
Similar Demographics by Disability
Demographics Similar to Ugandans by Disability
In terms of disability, the demographic groups most similar to Ugandans are Immigrants from St. Vincent and the Grenadines (11.4%, a difference of 0.010%), Immigrants from Guyana (11.4%, a difference of 0.050%), Kenyan (11.5%, a difference of 0.080%), New Zealander (11.5%, a difference of 0.090%), and Ghanaian (11.5%, a difference of 0.10%).
| Demographics | Rating | Rank | Disability |
| Immigrants | Europe | 90.4 /100 | #128 | Exceptional 11.4% |
| Macedonians | 90.3 /100 | #129 | Exceptional 11.4% |
| Latvians | 89.8 /100 | #130 | Excellent 11.4% |
| Immigrants | Croatia | 89.8 /100 | #131 | Excellent 11.4% |
| Immigrants | Africa | 89.3 /100 | #132 | Excellent 11.4% |
| Arabs | 89.1 /100 | #133 | Excellent 11.4% |
| Immigrants | Guyana | 88.3 /100 | #134 | Excellent 11.4% |
| Ugandans | 87.9 /100 | #135 | Excellent 11.4% |
| Immigrants | St. Vincent and the Grenadines | 87.8 /100 | #136 | Excellent 11.4% |
| Kenyans | 87.1 /100 | #137 | Excellent 11.5% |
| New Zealanders | 87.0 /100 | #138 | Excellent 11.5% |
| Ghanaians | 87.0 /100 | #139 | Excellent 11.5% |
| Russians | 86.8 /100 | #140 | Excellent 11.5% |
| Immigrants | Grenada | 86.1 /100 | #141 | Excellent 11.5% |
| Immigrants | Sudan | 85.3 /100 | #142 | Excellent 11.5% |
Demographics Similar to Lumbee by Disability
In terms of disability, the demographic groups most similar to Lumbee are Kiowa (15.6%, a difference of 0.45%), Creek (15.6%, a difference of 0.47%), Choctaw (15.4%, a difference of 0.84%), Colville (15.8%, a difference of 1.7%), and Chickasaw (15.2%, a difference of 2.3%).
| Demographics | Rating | Rank | Disability |
| Cajuns | 0.0 /100 | #333 | Tragic 14.6% |
| Yuman | 0.0 /100 | #334 | Tragic 14.6% |
| Tohono O'odham | 0.0 /100 | #335 | Tragic 14.8% |
| Cherokee | 0.0 /100 | #336 | Tragic 14.8% |
| Seminole | 0.0 /100 | #337 | Tragic 14.9% |
| Dutch West Indians | 0.0 /100 | #338 | Tragic 14.9% |
| Chickasaw | 0.0 /100 | #339 | Tragic 15.2% |
| Choctaw | 0.0 /100 | #340 | Tragic 15.4% |
| Lumbee | 0.0 /100 | #341 | Tragic 15.5% |
| Kiowa | 0.0 /100 | #342 | Tragic 15.6% |
| Creek | 0.0 /100 | #343 | Tragic 15.6% |
| Colville | 0.0 /100 | #344 | Tragic 15.8% |
| Puerto Ricans | 0.0 /100 | #345 | Tragic 16.1% |
| Tsimshian | 0.0 /100 | #346 | Tragic 16.1% |
| Houma | 0.0 /100 | #347 | Tragic 17.1% |