Celtic vs Latvian Births to Unmarried Women
COMPARE
Celtic
Latvian
Births to Unmarried Women
Births to Unmarried Women Comparison
Celtics
Latvians
33.3%
BIRTHS TO UNMARRIED WOMEN
10.2/ 100
METRIC RATING
212th/ 347
METRIC RANK
27.7%
BIRTHS TO UNMARRIED WOMEN
99.5/ 100
METRIC RATING
45th/ 347
METRIC RANK
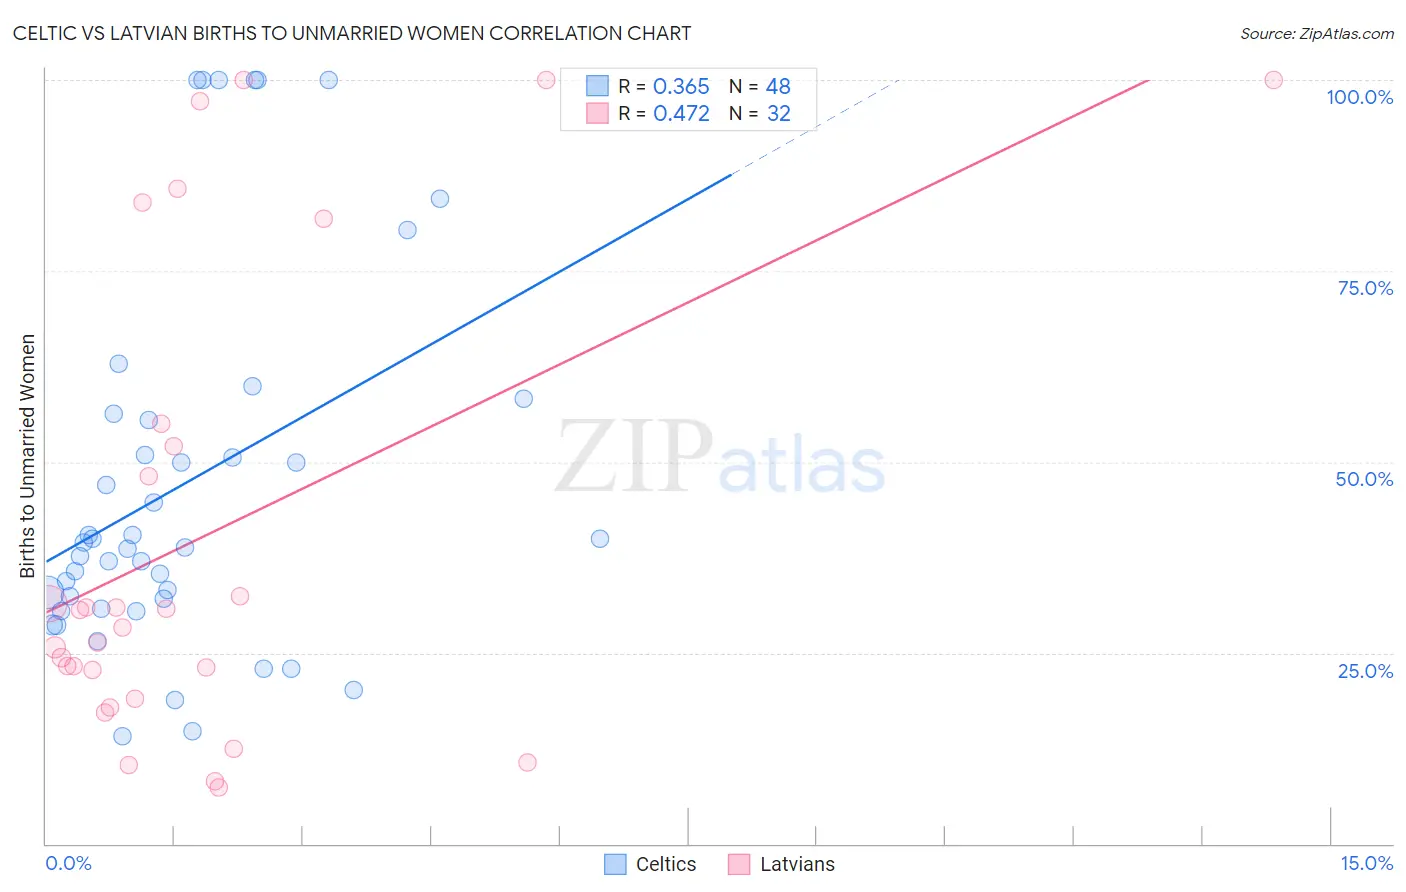
Celtic vs Latvian Births to Unmarried Women Correlation Chart
The statistical analysis conducted on geographies consisting of 162,463,744 people shows a mild positive correlation between the proportion of Celtics and percentage of births to unmarried women in the United States with a correlation coefficient (R) of 0.365 and weighted average of 33.3%. Similarly, the statistical analysis conducted on geographies consisting of 206,794,611 people shows a moderate positive correlation between the proportion of Latvians and percentage of births to unmarried women in the United States with a correlation coefficient (R) of 0.472 and weighted average of 27.7%, a difference of 20.1%.
Births to Unmarried Women Correlation Summary
| Measurement | Celtic | Latvian |
| Minimum | 14.0% | 7.4% |
| Maximum | 100.0% | 100.0% |
| Range | 86.0% | 92.6% |
| Mean | 47.2% | 40.3% |
| Median | 39.1% | 29.5% |
| Interquartile 25% (IQ1) | 31.5% | 20.8% |
| Interquartile 75% (IQ3) | 55.9% | 53.6% |
| Interquartile Range (IQR) | 24.4% | 32.7% |
| Standard Deviation (Sample) | 24.7% | 30.4% |
| Standard Deviation (Population) | 24.5% | 29.9% |
Similar Demographics by Births to Unmarried Women
Demographics Similar to Celtics by Births to Unmarried Women
In terms of births to unmarried women, the demographic groups most similar to Celtics are Ecuadorian (33.3%, a difference of 0.070%), White/Caucasian (33.3%, a difference of 0.12%), Scotch-Irish (33.3%, a difference of 0.12%), Immigrants from Costa Rica (33.4%, a difference of 0.19%), and Slovak (33.4%, a difference of 0.24%).
| Demographics | Rating | Rank | Births to Unmarried Women |
| German Russians | 13.1 /100 | #205 | Poor 33.1% |
| Uruguayans | 12.8 /100 | #206 | Poor 33.1% |
| Immigrants | Sudan | 11.5 /100 | #207 | Poor 33.2% |
| Hawaiians | 11.3 /100 | #208 | Poor 33.2% |
| Whites/Caucasians | 10.7 /100 | #209 | Poor 33.3% |
| Scotch-Irish | 10.7 /100 | #210 | Poor 33.3% |
| Ecuadorians | 10.5 /100 | #211 | Poor 33.3% |
| Celtics | 10.2 /100 | #212 | Poor 33.3% |
| Immigrants | Costa Rica | 9.5 /100 | #213 | Tragic 33.4% |
| Slovaks | 9.3 /100 | #214 | Tragic 33.4% |
| French | 8.7 /100 | #215 | Tragic 33.4% |
| Nepalese | 7.8 /100 | #216 | Tragic 33.5% |
| Spaniards | 7.0 /100 | #217 | Tragic 33.6% |
| Immigrants | Ecuador | 5.9 /100 | #218 | Tragic 33.7% |
| Alsatians | 5.4 /100 | #219 | Tragic 33.8% |
Demographics Similar to Latvians by Births to Unmarried Women
In terms of births to unmarried women, the demographic groups most similar to Latvians are Immigrants from Lithuania (27.7%, a difference of 0.040%), Hmong (27.7%, a difference of 0.040%), Eastern European (27.7%, a difference of 0.060%), Immigrants from Indonesia (27.7%, a difference of 0.090%), and Immigrants from Greece (27.8%, a difference of 0.24%).
| Demographics | Rating | Rank | Births to Unmarried Women |
| Immigrants | Moldova | 99.7 /100 | #38 | Exceptional 27.3% |
| Immigrants | Malaysia | 99.7 /100 | #39 | Exceptional 27.4% |
| Turks | 99.6 /100 | #40 | Exceptional 27.4% |
| Iraqis | 99.6 /100 | #41 | Exceptional 27.6% |
| Immigrants | Eastern Europe | 99.6 /100 | #42 | Exceptional 27.6% |
| Immigrants | Bulgaria | 99.6 /100 | #43 | Exceptional 27.6% |
| Immigrants | Indonesia | 99.5 /100 | #44 | Exceptional 27.7% |
| Latvians | 99.5 /100 | #45 | Exceptional 27.7% |
| Immigrants | Lithuania | 99.5 /100 | #46 | Exceptional 27.7% |
| Hmong | 99.5 /100 | #47 | Exceptional 27.7% |
| Eastern Europeans | 99.5 /100 | #48 | Exceptional 27.7% |
| Immigrants | Greece | 99.4 /100 | #49 | Exceptional 27.8% |
| Maltese | 99.4 /100 | #50 | Exceptional 27.8% |
| Macedonians | 99.4 /100 | #51 | Exceptional 27.9% |
| Bhutanese | 99.4 /100 | #52 | Exceptional 27.9% |