Cuban vs Latvian Births to Unmarried Women
COMPARE
Cuban
Latvian
Births to Unmarried Women
Births to Unmarried Women Comparison
Cubans
Latvians
39.4%
BIRTHS TO UNMARRIED WOMEN
0.0/ 100
METRIC RATING
309th/ 347
METRIC RANK
27.7%
BIRTHS TO UNMARRIED WOMEN
99.5/ 100
METRIC RATING
45th/ 347
METRIC RANK
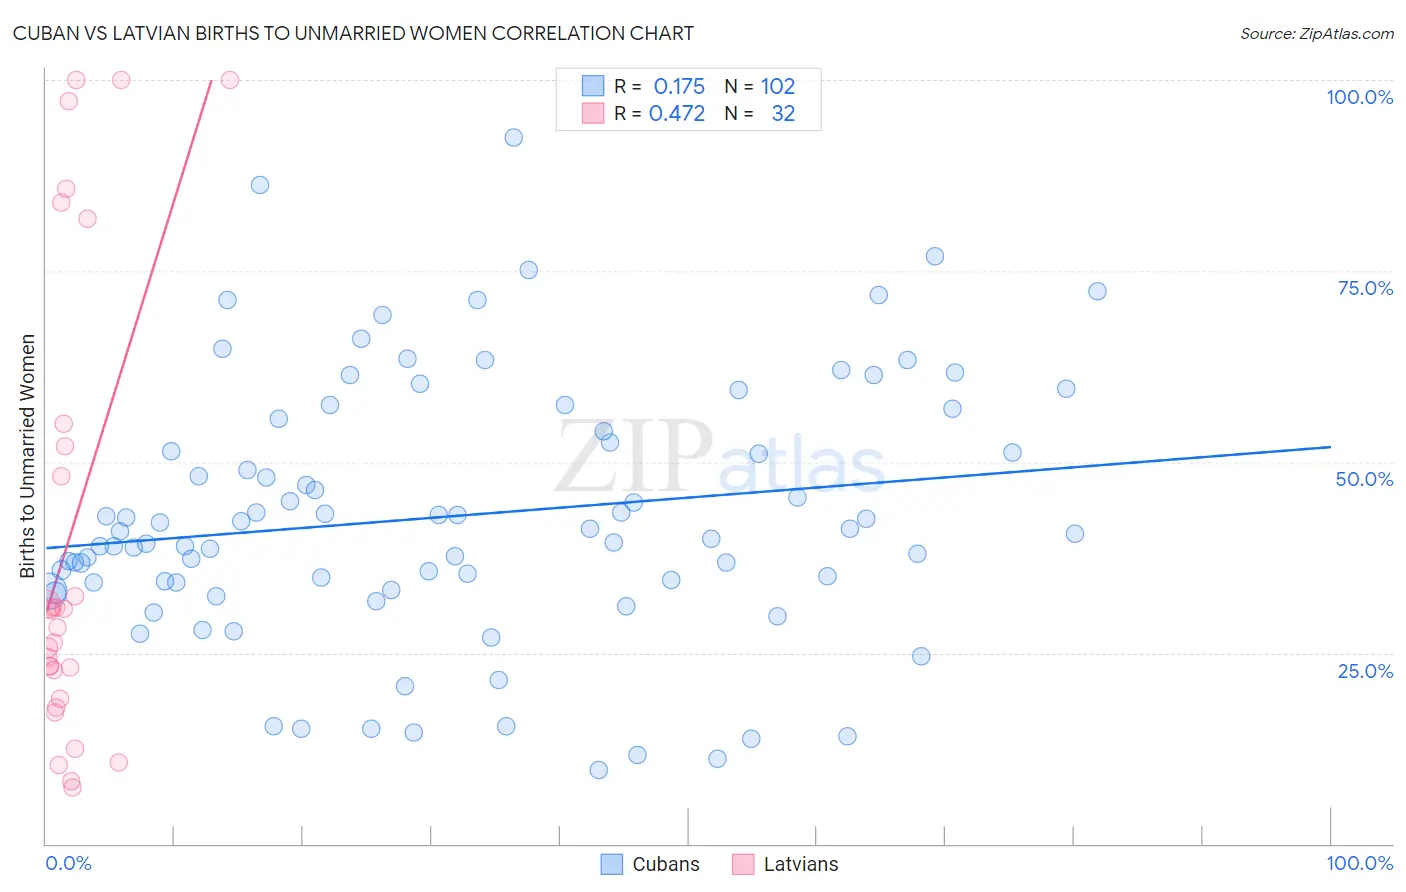
Cuban vs Latvian Births to Unmarried Women Correlation Chart
The statistical analysis conducted on geographies consisting of 417,413,482 people shows a poor positive correlation between the proportion of Cubans and percentage of births to unmarried women in the United States with a correlation coefficient (R) of 0.175 and weighted average of 39.4%. Similarly, the statistical analysis conducted on geographies consisting of 206,794,611 people shows a moderate positive correlation between the proportion of Latvians and percentage of births to unmarried women in the United States with a correlation coefficient (R) of 0.472 and weighted average of 27.7%, a difference of 42.1%.
Births to Unmarried Women Correlation Summary
| Measurement | Cuban | Latvian |
| Minimum | 9.6% | 7.4% |
| Maximum | 92.5% | 100.0% |
| Range | 82.9% | 92.6% |
| Mean | 42.9% | 40.3% |
| Median | 40.7% | 29.5% |
| Interquartile 25% (IQ1) | 34.2% | 20.8% |
| Interquartile 75% (IQ3) | 54.0% | 53.6% |
| Interquartile Range (IQR) | 19.8% | 32.7% |
| Standard Deviation (Sample) | 17.0% | 30.4% |
| Standard Deviation (Population) | 16.9% | 29.9% |
Similar Demographics by Births to Unmarried Women
Demographics Similar to Cubans by Births to Unmarried Women
In terms of births to unmarried women, the demographic groups most similar to Cubans are Aleut (39.3%, a difference of 0.12%), Immigrants from Honduras (39.3%, a difference of 0.21%), Immigrants from Dominica (39.5%, a difference of 0.22%), Immigrants from the Azores (39.6%, a difference of 0.46%), and U.S. Virgin Islander (39.6%, a difference of 0.48%).
| Demographics | Rating | Rank | Births to Unmarried Women |
| Hondurans | 0.0 /100 | #302 | Tragic 38.7% |
| Immigrants | Jamaica | 0.0 /100 | #303 | Tragic 38.8% |
| Yaqui | 0.0 /100 | #304 | Tragic 38.8% |
| Immigrants | Haiti | 0.0 /100 | #305 | Tragic 38.9% |
| Central American Indians | 0.0 /100 | #306 | Tragic 39.0% |
| Immigrants | Honduras | 0.0 /100 | #307 | Tragic 39.3% |
| Aleuts | 0.0 /100 | #308 | Tragic 39.3% |
| Cubans | 0.0 /100 | #309 | Tragic 39.4% |
| Immigrants | Dominica | 0.0 /100 | #310 | Tragic 39.5% |
| Immigrants | Azores | 0.0 /100 | #311 | Tragic 39.6% |
| U.S. Virgin Islanders | 0.0 /100 | #312 | Tragic 39.6% |
| Africans | 0.0 /100 | #313 | Tragic 39.7% |
| Immigrants | Caribbean | 0.0 /100 | #314 | Tragic 39.8% |
| Dominicans | 0.0 /100 | #315 | Tragic 39.8% |
| Apache | 0.0 /100 | #316 | Tragic 39.9% |
Demographics Similar to Latvians by Births to Unmarried Women
In terms of births to unmarried women, the demographic groups most similar to Latvians are Immigrants from Lithuania (27.7%, a difference of 0.040%), Hmong (27.7%, a difference of 0.040%), Eastern European (27.7%, a difference of 0.060%), Immigrants from Indonesia (27.7%, a difference of 0.090%), and Immigrants from Greece (27.8%, a difference of 0.24%).
| Demographics | Rating | Rank | Births to Unmarried Women |
| Immigrants | Moldova | 99.7 /100 | #38 | Exceptional 27.3% |
| Immigrants | Malaysia | 99.7 /100 | #39 | Exceptional 27.4% |
| Turks | 99.6 /100 | #40 | Exceptional 27.4% |
| Iraqis | 99.6 /100 | #41 | Exceptional 27.6% |
| Immigrants | Eastern Europe | 99.6 /100 | #42 | Exceptional 27.6% |
| Immigrants | Bulgaria | 99.6 /100 | #43 | Exceptional 27.6% |
| Immigrants | Indonesia | 99.5 /100 | #44 | Exceptional 27.7% |
| Latvians | 99.5 /100 | #45 | Exceptional 27.7% |
| Immigrants | Lithuania | 99.5 /100 | #46 | Exceptional 27.7% |
| Hmong | 99.5 /100 | #47 | Exceptional 27.7% |
| Eastern Europeans | 99.5 /100 | #48 | Exceptional 27.7% |
| Immigrants | Greece | 99.4 /100 | #49 | Exceptional 27.8% |
| Maltese | 99.4 /100 | #50 | Exceptional 27.8% |
| Macedonians | 99.4 /100 | #51 | Exceptional 27.9% |
| Bhutanese | 99.4 /100 | #52 | Exceptional 27.9% |