Tlingit-Haida vs Immigrants from Fiji Family Households
COMPARE
Tlingit-Haida
Immigrants from Fiji
Family Households
Family Households Comparison
Tlingit-Haida
Immigrants from Fiji
61.6%
FAMILY HOUSEHOLDS
0.0/ 100
METRIC RATING
323rd/ 347
METRIC RANK
68.8%
FAMILY HOUSEHOLDS
100.0/ 100
METRIC RATING
8th/ 347
METRIC RANK
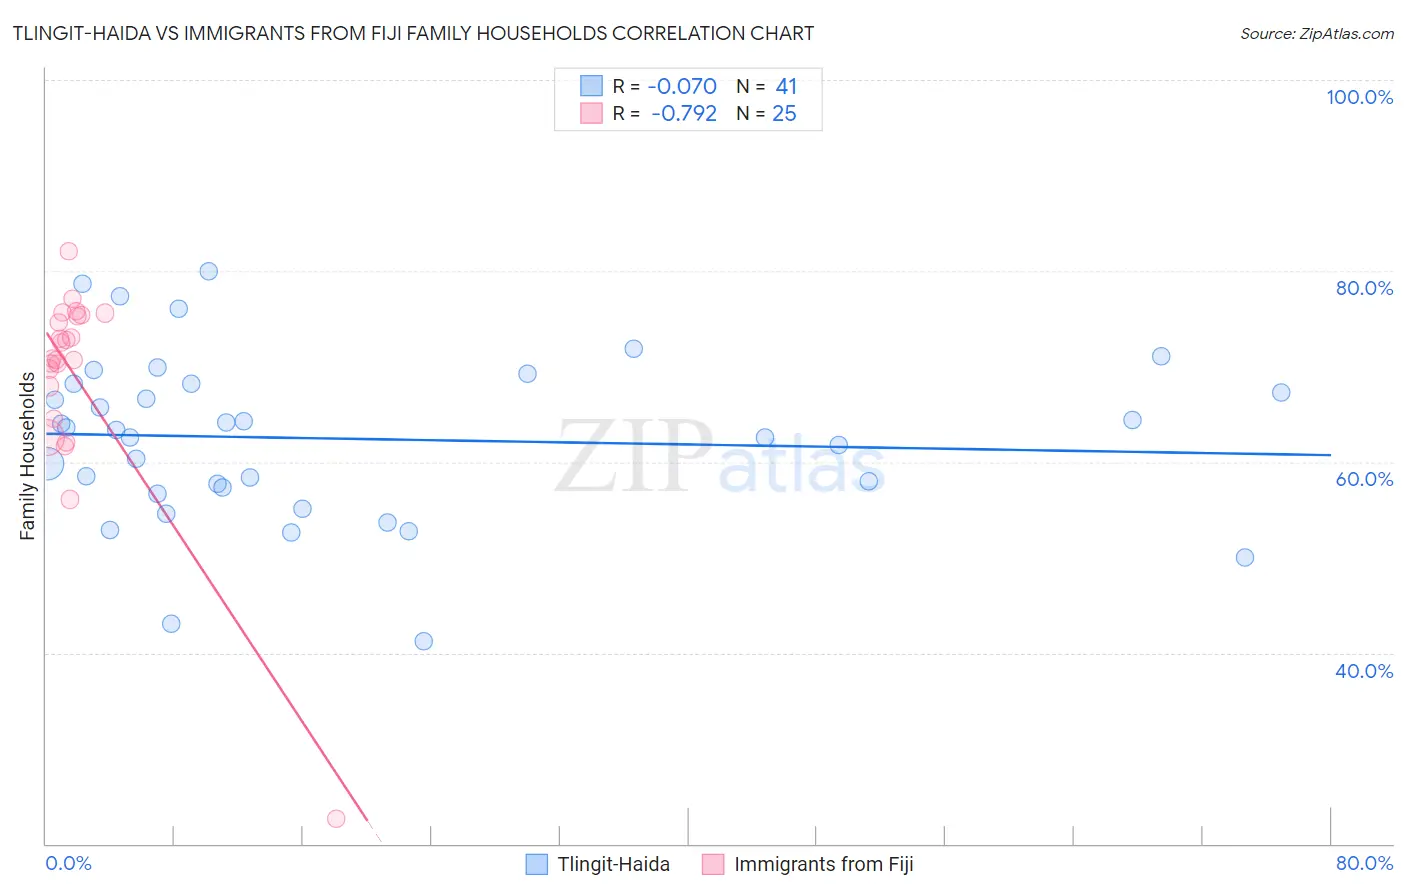
Tlingit-Haida vs Immigrants from Fiji Family Households Correlation Chart
The statistical analysis conducted on geographies consisting of 60,855,548 people shows a slight negative correlation between the proportion of Tlingit-Haida and percentage of family households in the United States with a correlation coefficient (R) of -0.070 and weighted average of 61.6%. Similarly, the statistical analysis conducted on geographies consisting of 93,754,900 people shows a strong negative correlation between the proportion of Immigrants from Fiji and percentage of family households in the United States with a correlation coefficient (R) of -0.792 and weighted average of 68.8%, a difference of 11.6%.
Family Households Correlation Summary
| Measurement | Tlingit-Haida | Immigrants from Fiji |
| Minimum | 41.2% | 22.7% |
| Maximum | 80.0% | 82.1% |
| Range | 38.8% | 59.5% |
| Mean | 62.4% | 68.9% |
| Median | 63.4% | 70.8% |
| Interquartile 25% (IQ1) | 57.0% | 66.2% |
| Interquartile 75% (IQ3) | 68.2% | 75.3% |
| Interquartile Range (IQR) | 11.2% | 9.0% |
| Standard Deviation (Sample) | 8.7% | 11.2% |
| Standard Deviation (Population) | 8.6% | 11.0% |
Similar Demographics by Family Households
Demographics Similar to Tlingit-Haida by Family Households
In terms of family households, the demographic groups most similar to Tlingit-Haida are Immigrants from Serbia (61.6%, a difference of 0.010%), Immigrants from West Indies (61.6%, a difference of 0.010%), Immigrants from Switzerland (61.6%, a difference of 0.020%), Alsatian (61.7%, a difference of 0.10%), and Ugandan (61.7%, a difference of 0.15%).
| Demographics | Rating | Rank | Family Households |
| Immigrants | Middle Africa | 0.0 /100 | #316 | Tragic 61.9% |
| Immigrants | Bosnia and Herzegovina | 0.0 /100 | #317 | Tragic 61.9% |
| Alaskan Athabascans | 0.0 /100 | #318 | Tragic 61.8% |
| Cape Verdeans | 0.0 /100 | #319 | Tragic 61.8% |
| Ugandans | 0.0 /100 | #320 | Tragic 61.7% |
| Alsatians | 0.0 /100 | #321 | Tragic 61.7% |
| Immigrants | Serbia | 0.0 /100 | #322 | Tragic 61.6% |
| Tlingit-Haida | 0.0 /100 | #323 | Tragic 61.6% |
| Immigrants | West Indies | 0.0 /100 | #324 | Tragic 61.6% |
| Immigrants | Switzerland | 0.0 /100 | #325 | Tragic 61.6% |
| Indonesians | 0.0 /100 | #326 | Tragic 61.5% |
| Blacks/African Americans | 0.0 /100 | #327 | Tragic 61.5% |
| Kiowa | 0.0 /100 | #328 | Tragic 61.4% |
| Cambodians | 0.0 /100 | #329 | Tragic 61.4% |
| Immigrants | Australia | 0.0 /100 | #330 | Tragic 61.3% |
Demographics Similar to Immigrants from Fiji by Family Households
In terms of family households, the demographic groups most similar to Immigrants from Fiji are Mexican (69.0%, a difference of 0.32%), Immigrants from Mexico (69.1%, a difference of 0.53%), Native Hawaiian (68.4%, a difference of 0.56%), Immigrants from Philippines (68.3%, a difference of 0.63%), and Immigrants from Central America (68.3%, a difference of 0.70%).
| Demographics | Rating | Rank | Family Households |
| Yup'ik | 100 /100 | #1 | Exceptional 72.4% |
| Spanish American Indians | 100.0 /100 | #2 | Exceptional 71.2% |
| Tongans | 100.0 /100 | #3 | Exceptional 69.6% |
| Yakama | 100.0 /100 | #4 | Exceptional 69.3% |
| Yuman | 100.0 /100 | #5 | Exceptional 69.3% |
| Immigrants | Mexico | 100.0 /100 | #6 | Exceptional 69.1% |
| Mexicans | 100.0 /100 | #7 | Exceptional 69.0% |
| Immigrants | Fiji | 100.0 /100 | #8 | Exceptional 68.8% |
| Native Hawaiians | 100.0 /100 | #9 | Exceptional 68.4% |
| Immigrants | Philippines | 100.0 /100 | #10 | Exceptional 68.3% |
| Immigrants | Central America | 100.0 /100 | #11 | Exceptional 68.3% |
| Koreans | 100.0 /100 | #12 | Exceptional 68.3% |
| Pueblo | 100.0 /100 | #13 | Exceptional 68.2% |
| Immigrants | Cuba | 100.0 /100 | #14 | Exceptional 68.2% |
| Assyrians/Chaldeans/Syriacs | 100.0 /100 | #15 | Exceptional 68.2% |