Bahamian vs Immigrants from Fiji Family Households
COMPARE
Bahamian
Immigrants from Fiji
Family Households
Family Households Comparison
Bahamians
Immigrants from Fiji
63.3%
FAMILY HOUSEHOLDS
1.1/ 100
METRIC RATING
252nd/ 347
METRIC RANK
68.8%
FAMILY HOUSEHOLDS
100.0/ 100
METRIC RATING
8th/ 347
METRIC RANK
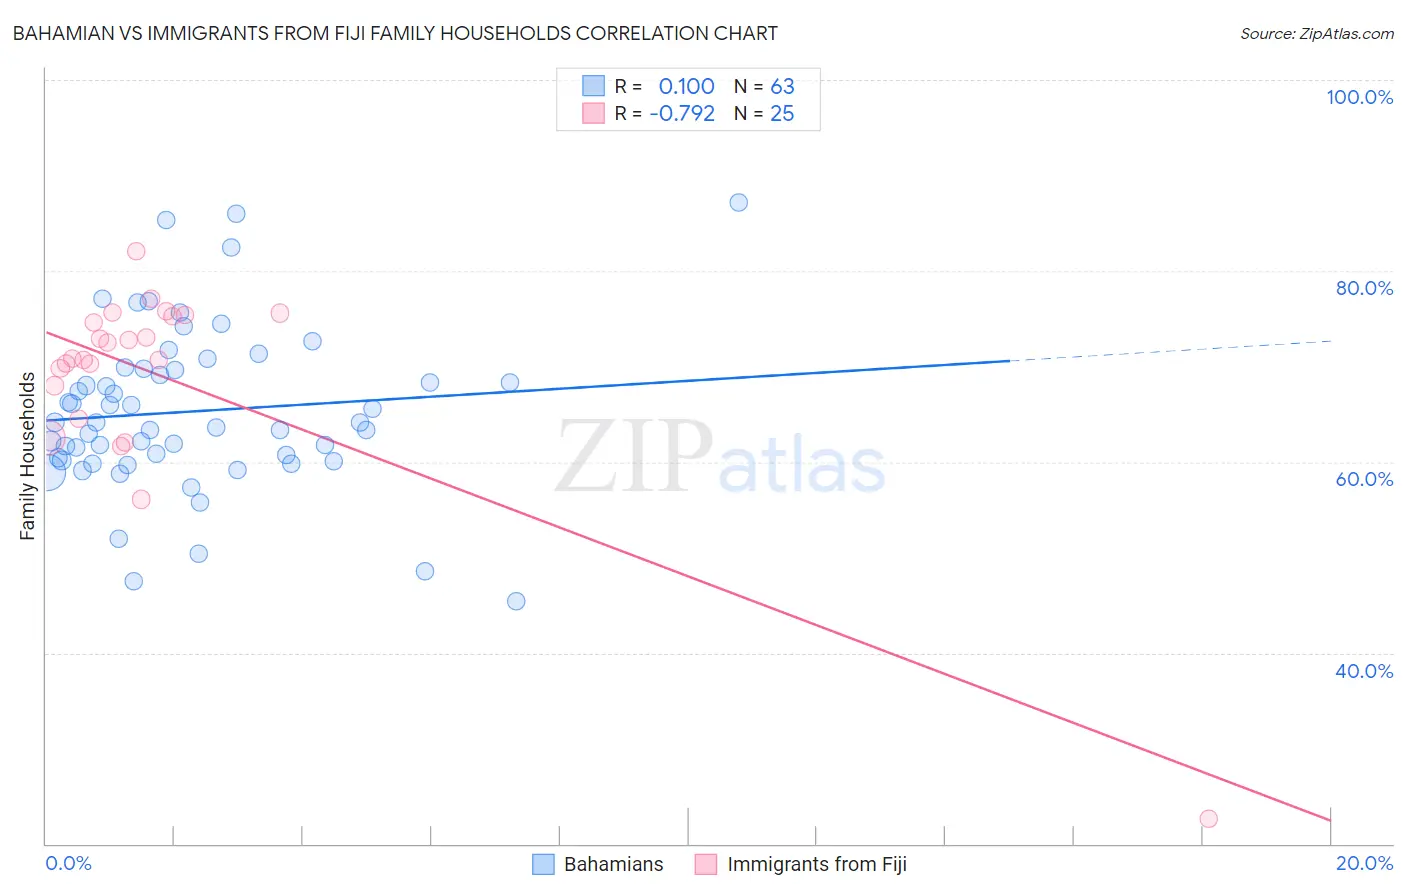
Bahamian vs Immigrants from Fiji Family Households Correlation Chart
The statistical analysis conducted on geographies consisting of 112,635,727 people shows a slight positive correlation between the proportion of Bahamians and percentage of family households in the United States with a correlation coefficient (R) of 0.100 and weighted average of 63.3%. Similarly, the statistical analysis conducted on geographies consisting of 93,754,900 people shows a strong negative correlation between the proportion of Immigrants from Fiji and percentage of family households in the United States with a correlation coefficient (R) of -0.792 and weighted average of 68.8%, a difference of 8.6%.
Family Households Correlation Summary
| Measurement | Bahamian | Immigrants from Fiji |
| Minimum | 45.4% | 22.7% |
| Maximum | 87.2% | 82.1% |
| Range | 41.8% | 59.5% |
| Mean | 65.3% | 68.9% |
| Median | 64.1% | 70.8% |
| Interquartile 25% (IQ1) | 60.1% | 66.2% |
| Interquartile 75% (IQ3) | 69.7% | 75.3% |
| Interquartile Range (IQR) | 9.6% | 9.0% |
| Standard Deviation (Sample) | 8.6% | 11.2% |
| Standard Deviation (Population) | 8.5% | 11.0% |
Similar Demographics by Family Households
Demographics Similar to Bahamians by Family Households
In terms of family households, the demographic groups most similar to Bahamians are Taiwanese (63.3%, a difference of 0.010%), Immigrants from Dominican Republic (63.3%, a difference of 0.020%), Slovak (63.3%, a difference of 0.030%), Potawatomi (63.3%, a difference of 0.050%), and Immigrants from Japan (63.4%, a difference of 0.070%).
| Demographics | Rating | Rank | Family Households |
| Immigrants | Dominica | 1.6 /100 | #245 | Tragic 63.4% |
| Immigrants | Ghana | 1.6 /100 | #246 | Tragic 63.4% |
| Immigrants | Uzbekistan | 1.5 /100 | #247 | Tragic 63.4% |
| Dominicans | 1.5 /100 | #248 | Tragic 63.4% |
| Russians | 1.4 /100 | #249 | Tragic 63.4% |
| Immigrants | Japan | 1.4 /100 | #250 | Tragic 63.4% |
| Taiwanese | 1.2 /100 | #251 | Tragic 63.3% |
| Bahamians | 1.1 /100 | #252 | Tragic 63.3% |
| Immigrants | Dominican Republic | 1.0 /100 | #253 | Tragic 63.3% |
| Slovaks | 1.0 /100 | #254 | Tragic 63.3% |
| Potawatomi | 1.0 /100 | #255 | Tragic 63.3% |
| Luxembourgers | 0.9 /100 | #256 | Tragic 63.3% |
| Icelanders | 0.8 /100 | #257 | Tragic 63.3% |
| Immigrants | Barbados | 0.7 /100 | #258 | Tragic 63.2% |
| Immigrants | Western Europe | 0.6 /100 | #259 | Tragic 63.2% |
Demographics Similar to Immigrants from Fiji by Family Households
In terms of family households, the demographic groups most similar to Immigrants from Fiji are Mexican (69.0%, a difference of 0.32%), Immigrants from Mexico (69.1%, a difference of 0.53%), Native Hawaiian (68.4%, a difference of 0.56%), Immigrants from Philippines (68.3%, a difference of 0.63%), and Immigrants from Central America (68.3%, a difference of 0.70%).
| Demographics | Rating | Rank | Family Households |
| Yup'ik | 100 /100 | #1 | Exceptional 72.4% |
| Spanish American Indians | 100.0 /100 | #2 | Exceptional 71.2% |
| Tongans | 100.0 /100 | #3 | Exceptional 69.6% |
| Yakama | 100.0 /100 | #4 | Exceptional 69.3% |
| Yuman | 100.0 /100 | #5 | Exceptional 69.3% |
| Immigrants | Mexico | 100.0 /100 | #6 | Exceptional 69.1% |
| Mexicans | 100.0 /100 | #7 | Exceptional 69.0% |
| Immigrants | Fiji | 100.0 /100 | #8 | Exceptional 68.8% |
| Native Hawaiians | 100.0 /100 | #9 | Exceptional 68.4% |
| Immigrants | Philippines | 100.0 /100 | #10 | Exceptional 68.3% |
| Immigrants | Central America | 100.0 /100 | #11 | Exceptional 68.3% |
| Koreans | 100.0 /100 | #12 | Exceptional 68.3% |
| Pueblo | 100.0 /100 | #13 | Exceptional 68.2% |
| Immigrants | Cuba | 100.0 /100 | #14 | Exceptional 68.2% |
| Assyrians/Chaldeans/Syriacs | 100.0 /100 | #15 | Exceptional 68.2% |