Tlingit-Haida vs Immigrants from Austria Family Households
COMPARE
Tlingit-Haida
Immigrants from Austria
Family Households
Family Households Comparison
Tlingit-Haida
Immigrants from Austria
61.6%
FAMILY HOUSEHOLDS
0.0/ 100
METRIC RATING
323rd/ 347
METRIC RANK
63.1%
FAMILY HOUSEHOLDS
0.3/ 100
METRIC RATING
270th/ 347
METRIC RANK
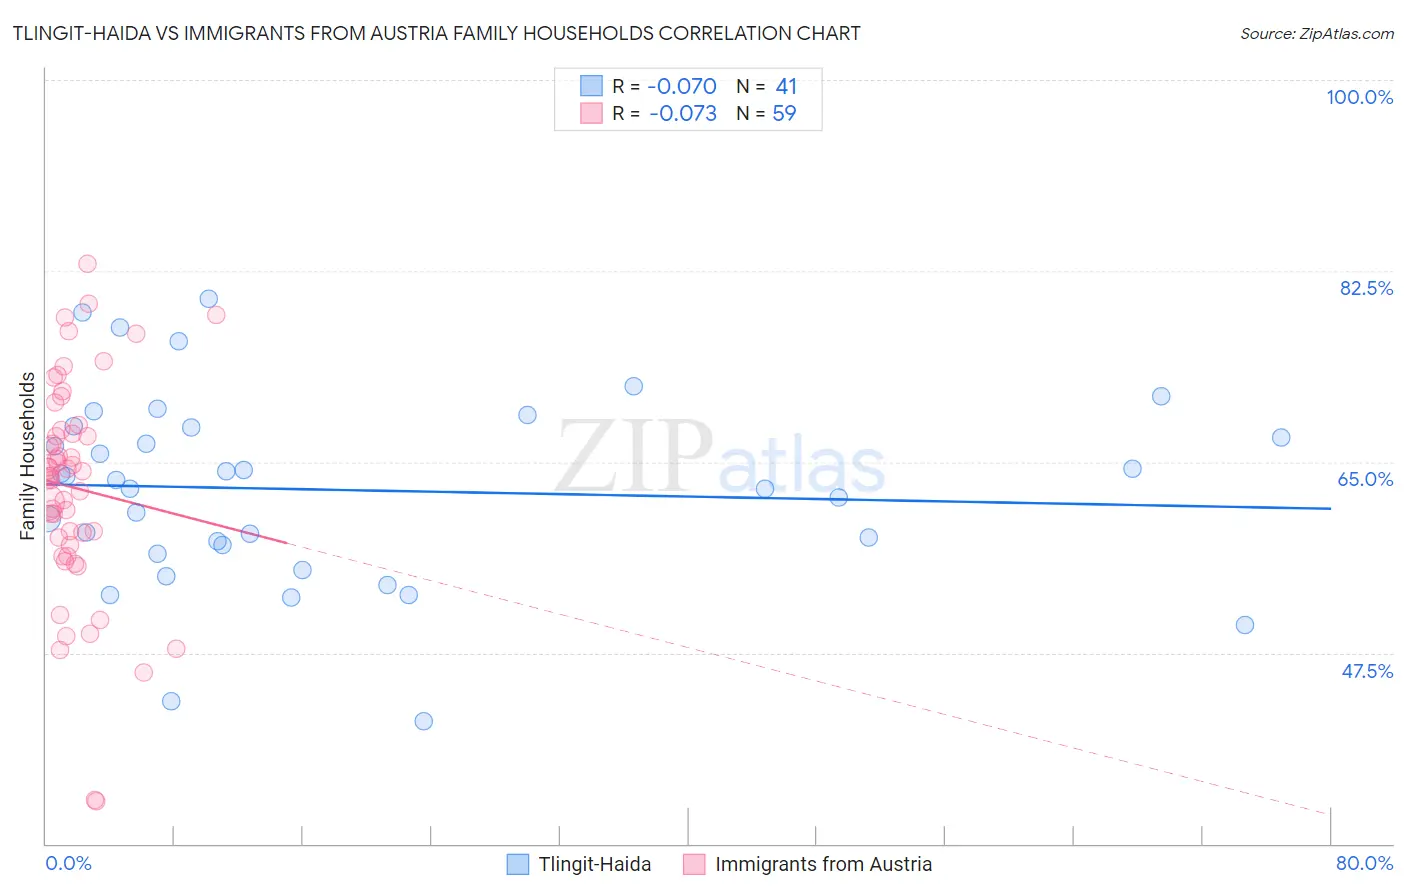
Tlingit-Haida vs Immigrants from Austria Family Households Correlation Chart
The statistical analysis conducted on geographies consisting of 60,855,548 people shows a slight negative correlation between the proportion of Tlingit-Haida and percentage of family households in the United States with a correlation coefficient (R) of -0.070 and weighted average of 61.6%. Similarly, the statistical analysis conducted on geographies consisting of 167,966,875 people shows a slight negative correlation between the proportion of Immigrants from Austria and percentage of family households in the United States with a correlation coefficient (R) of -0.073 and weighted average of 63.1%, a difference of 2.4%.
Family Households Correlation Summary
| Measurement | Tlingit-Haida | Immigrants from Austria |
| Minimum | 41.2% | 33.9% |
| Maximum | 80.0% | 83.1% |
| Range | 38.8% | 49.2% |
| Mean | 62.4% | 62.6% |
| Median | 63.4% | 63.7% |
| Interquartile 25% (IQ1) | 57.0% | 57.4% |
| Interquartile 75% (IQ3) | 68.2% | 67.9% |
| Interquartile Range (IQR) | 11.2% | 10.5% |
| Standard Deviation (Sample) | 8.7% | 10.0% |
| Standard Deviation (Population) | 8.6% | 10.0% |
Similar Demographics by Family Households
Demographics Similar to Tlingit-Haida by Family Households
In terms of family households, the demographic groups most similar to Tlingit-Haida are Immigrants from Serbia (61.6%, a difference of 0.010%), Immigrants from West Indies (61.6%, a difference of 0.010%), Immigrants from Switzerland (61.6%, a difference of 0.020%), Alsatian (61.7%, a difference of 0.10%), and Ugandan (61.7%, a difference of 0.15%).
| Demographics | Rating | Rank | Family Households |
| Immigrants | Middle Africa | 0.0 /100 | #316 | Tragic 61.9% |
| Immigrants | Bosnia and Herzegovina | 0.0 /100 | #317 | Tragic 61.9% |
| Alaskan Athabascans | 0.0 /100 | #318 | Tragic 61.8% |
| Cape Verdeans | 0.0 /100 | #319 | Tragic 61.8% |
| Ugandans | 0.0 /100 | #320 | Tragic 61.7% |
| Alsatians | 0.0 /100 | #321 | Tragic 61.7% |
| Immigrants | Serbia | 0.0 /100 | #322 | Tragic 61.6% |
| Tlingit-Haida | 0.0 /100 | #323 | Tragic 61.6% |
| Immigrants | West Indies | 0.0 /100 | #324 | Tragic 61.6% |
| Immigrants | Switzerland | 0.0 /100 | #325 | Tragic 61.6% |
| Indonesians | 0.0 /100 | #326 | Tragic 61.5% |
| Blacks/African Americans | 0.0 /100 | #327 | Tragic 61.5% |
| Kiowa | 0.0 /100 | #328 | Tragic 61.4% |
| Cambodians | 0.0 /100 | #329 | Tragic 61.4% |
| Immigrants | Australia | 0.0 /100 | #330 | Tragic 61.3% |
Demographics Similar to Immigrants from Austria by Family Households
In terms of family households, the demographic groups most similar to Immigrants from Austria are Immigrants from Croatia (63.1%, a difference of 0.010%), Immigrants from Turkey (63.1%, a difference of 0.010%), Immigrants from Singapore (63.1%, a difference of 0.020%), Yugoslavian (63.1%, a difference of 0.020%), and Immigrants from Kazakhstan (63.1%, a difference of 0.020%).
| Demographics | Rating | Rank | Family Households |
| Cheyenne | 0.5 /100 | #263 | Tragic 63.2% |
| Kenyans | 0.5 /100 | #264 | Tragic 63.2% |
| Colville | 0.5 /100 | #265 | Tragic 63.2% |
| Immigrants | Western Africa | 0.5 /100 | #266 | Tragic 63.1% |
| Israelis | 0.4 /100 | #267 | Tragic 63.1% |
| Immigrants | Singapore | 0.4 /100 | #268 | Tragic 63.1% |
| Yugoslavians | 0.4 /100 | #269 | Tragic 63.1% |
| Immigrants | Austria | 0.3 /100 | #270 | Tragic 63.1% |
| Immigrants | Croatia | 0.3 /100 | #271 | Tragic 63.1% |
| Immigrants | Turkey | 0.3 /100 | #272 | Tragic 63.1% |
| Immigrants | Kazakhstan | 0.3 /100 | #273 | Tragic 63.1% |
| Lumbee | 0.3 /100 | #274 | Tragic 63.1% |
| West Indians | 0.3 /100 | #275 | Tragic 63.1% |
| Serbians | 0.3 /100 | #276 | Tragic 63.0% |
| Ottawa | 0.3 /100 | #277 | Tragic 63.0% |