Tlingit-Haida vs Immigrants from Fiji No Schooling Completed
COMPARE
Tlingit-Haida
Immigrants from Fiji
No Schooling Completed
No Schooling Completed Comparison
Tlingit-Haida
Immigrants from Fiji
1.5%
NO SCHOOLING COMPLETED
100.0/ 100
METRIC RATING
15th/ 347
METRIC RANK
3.5%
NO SCHOOLING COMPLETED
0.0/ 100
METRIC RATING
336th/ 347
METRIC RANK
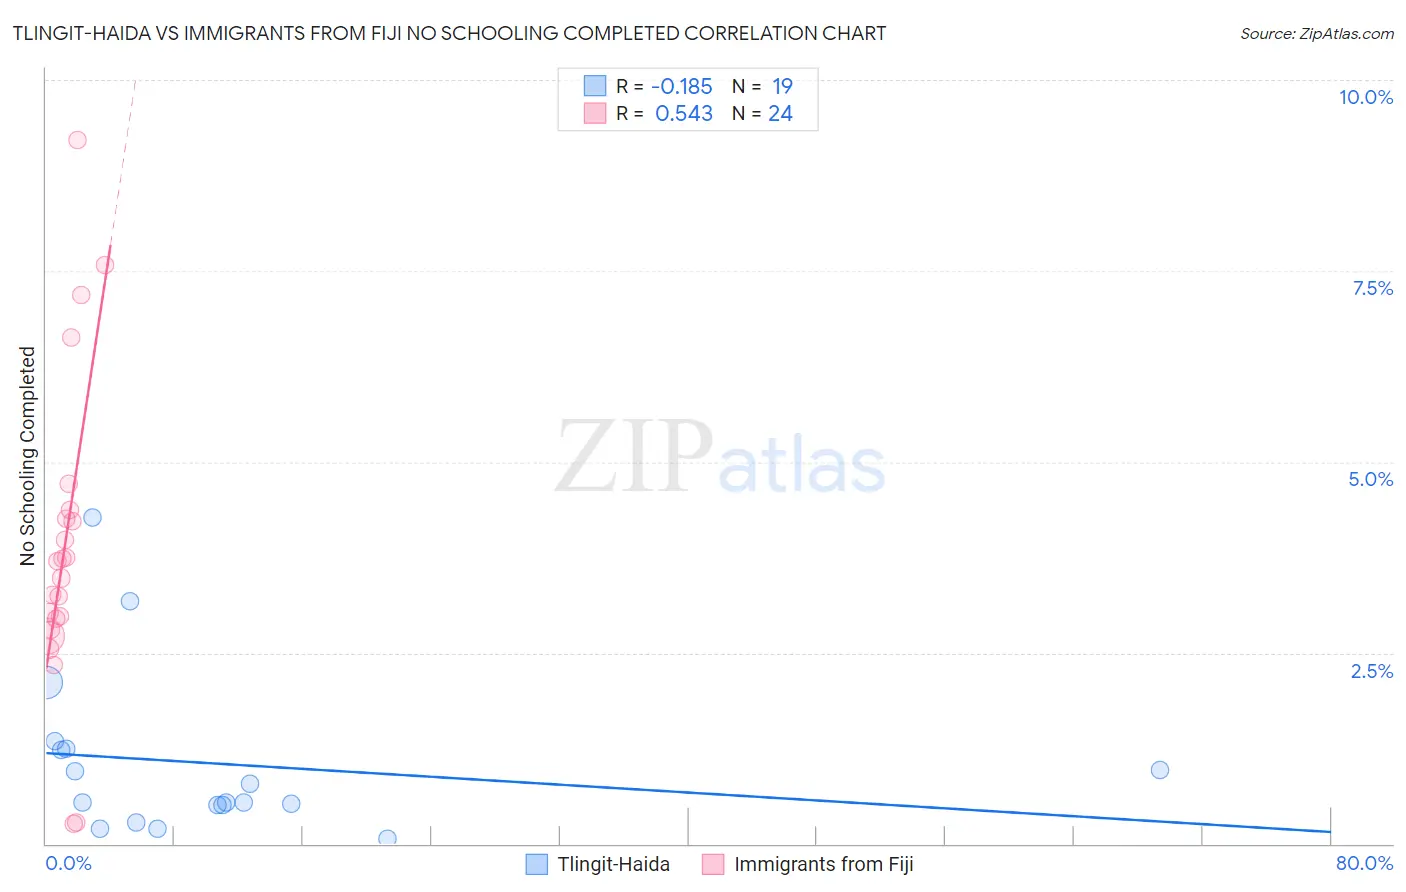
Tlingit-Haida vs Immigrants from Fiji No Schooling Completed Correlation Chart
The statistical analysis conducted on geographies consisting of 60,521,885 people shows a poor negative correlation between the proportion of Tlingit-Haida and percentage of population with no schooling in the United States with a correlation coefficient (R) of -0.185 and weighted average of 1.5%. Similarly, the statistical analysis conducted on geographies consisting of 93,588,914 people shows a substantial positive correlation between the proportion of Immigrants from Fiji and percentage of population with no schooling in the United States with a correlation coefficient (R) of 0.543 and weighted average of 3.5%, a difference of 141.6%.
No Schooling Completed Correlation Summary
| Measurement | Tlingit-Haida | Immigrants from Fiji |
| Minimum | 0.064% | 0.26% |
| Maximum | 4.3% | 9.2% |
| Range | 4.2% | 9.0% |
| Mean | 1.1% | 3.9% |
| Median | 0.55% | 3.6% |
| Interquartile 25% (IQ1) | 0.51% | 2.9% |
| Interquartile 75% (IQ3) | 1.2% | 4.3% |
| Interquartile Range (IQR) | 0.74% | 1.4% |
| Standard Deviation (Sample) | 1.1% | 2.1% |
| Standard Deviation (Population) | 1.0% | 2.0% |
Similar Demographics by No Schooling Completed
Demographics Similar to Tlingit-Haida by No Schooling Completed
In terms of no schooling completed, the demographic groups most similar to Tlingit-Haida are Scotch-Irish (1.5%, a difference of 0.060%), Finnish (1.5%, a difference of 0.52%), Croatian (1.5%, a difference of 0.53%), Danish (1.5%, a difference of 0.84%), and Alaskan Athabascan (1.5%, a difference of 0.94%).
| Demographics | Rating | Rank | No Schooling Completed |
| Swedes | 100.0 /100 | #8 | Exceptional 1.4% |
| Scottish | 100.0 /100 | #9 | Exceptional 1.4% |
| Dutch | 100.0 /100 | #10 | Exceptional 1.4% |
| Lithuanians | 100.0 /100 | #11 | Exceptional 1.4% |
| Irish | 100.0 /100 | #12 | Exceptional 1.4% |
| Poles | 100.0 /100 | #13 | Exceptional 1.4% |
| Scotch-Irish | 100.0 /100 | #14 | Exceptional 1.5% |
| Tlingit-Haida | 100.0 /100 | #15 | Exceptional 1.5% |
| Finns | 100.0 /100 | #16 | Exceptional 1.5% |
| Croatians | 100.0 /100 | #17 | Exceptional 1.5% |
| Danes | 100.0 /100 | #18 | Exceptional 1.5% |
| Alaskan Athabascans | 100.0 /100 | #19 | Exceptional 1.5% |
| Welsh | 100.0 /100 | #20 | Exceptional 1.5% |
| Chinese | 100.0 /100 | #21 | Exceptional 1.5% |
| Alaska Natives | 100.0 /100 | #22 | Exceptional 1.5% |
Demographics Similar to Immigrants from Fiji by No Schooling Completed
In terms of no schooling completed, the demographic groups most similar to Immigrants from Fiji are Immigrants from Cambodia (3.5%, a difference of 0.37%), Immigrants from Cabo Verde (3.5%, a difference of 0.71%), Bangladeshi (3.5%, a difference of 0.95%), Yakama (3.6%, a difference of 1.3%), and Guatemalan (3.5%, a difference of 1.4%).
| Demographics | Rating | Rank | No Schooling Completed |
| Immigrants | Vietnam | 0.0 /100 | #329 | Tragic 3.3% |
| Immigrants | Armenia | 0.0 /100 | #330 | Tragic 3.3% |
| Japanese | 0.0 /100 | #331 | Tragic 3.3% |
| Central Americans | 0.0 /100 | #332 | Tragic 3.4% |
| Immigrants | Dominican Republic | 0.0 /100 | #333 | Tragic 3.4% |
| Guatemalans | 0.0 /100 | #334 | Tragic 3.5% |
| Immigrants | Cambodia | 0.0 /100 | #335 | Tragic 3.5% |
| Immigrants | Fiji | 0.0 /100 | #336 | Tragic 3.5% |
| Immigrants | Cabo Verde | 0.0 /100 | #337 | Tragic 3.5% |
| Bangladeshis | 0.0 /100 | #338 | Tragic 3.5% |
| Yakama | 0.0 /100 | #339 | Tragic 3.6% |
| Immigrants | Guatemala | 0.0 /100 | #340 | Tragic 3.6% |
| Immigrants | Central America | 0.0 /100 | #341 | Tragic 3.6% |
| Immigrants | Mexico | 0.0 /100 | #342 | Tragic 3.6% |
| Salvadorans | 0.0 /100 | #343 | Tragic 3.7% |