Immigrants from Morocco vs Immigrants from Fiji Family Households
COMPARE
Immigrants from Morocco
Immigrants from Fiji
Family Households
Family Households Comparison
Immigrants from Morocco
Immigrants from Fiji
62.0%
FAMILY HOUSEHOLDS
0.0/ 100
METRIC RATING
311th/ 347
METRIC RANK
68.8%
FAMILY HOUSEHOLDS
100.0/ 100
METRIC RATING
8th/ 347
METRIC RANK
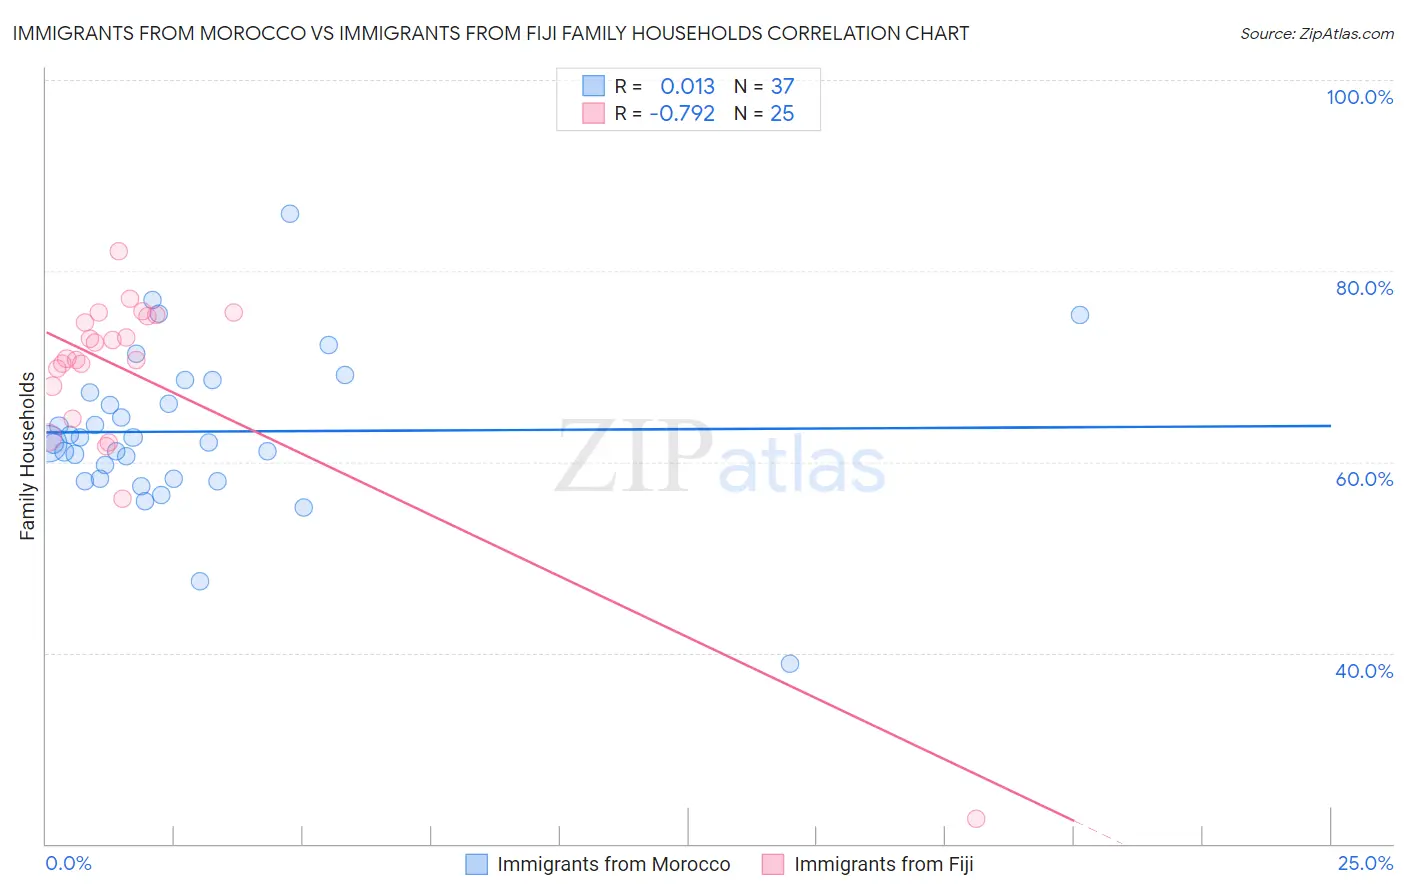
Immigrants from Morocco vs Immigrants from Fiji Family Households Correlation Chart
The statistical analysis conducted on geographies consisting of 178,909,930 people shows no correlation between the proportion of Immigrants from Morocco and percentage of family households in the United States with a correlation coefficient (R) of 0.013 and weighted average of 62.0%. Similarly, the statistical analysis conducted on geographies consisting of 93,754,900 people shows a strong negative correlation between the proportion of Immigrants from Fiji and percentage of family households in the United States with a correlation coefficient (R) of -0.792 and weighted average of 68.8%, a difference of 10.9%.
Family Households Correlation Summary
| Measurement | Immigrants from Morocco | Immigrants from Fiji |
| Minimum | 38.9% | 22.7% |
| Maximum | 86.0% | 82.1% |
| Range | 47.1% | 59.5% |
| Mean | 63.2% | 68.9% |
| Median | 62.0% | 70.8% |
| Interquartile 25% (IQ1) | 58.2% | 66.2% |
| Interquartile 75% (IQ3) | 67.9% | 75.3% |
| Interquartile Range (IQR) | 9.6% | 9.0% |
| Standard Deviation (Sample) | 8.3% | 11.2% |
| Standard Deviation (Population) | 8.2% | 11.0% |
Similar Demographics by Family Households
Demographics Similar to Immigrants from Morocco by Family Households
In terms of family households, the demographic groups most similar to Immigrants from Morocco are Immigrants from Liberia (62.0%, a difference of 0.030%), Immigrants from Latvia (62.0%, a difference of 0.050%), Liberian (62.0%, a difference of 0.050%), Subsaharan African (62.1%, a difference of 0.070%), and Immigrants from Cabo Verde (61.9%, a difference of 0.10%).
| Demographics | Rating | Rank | Family Households |
| Iroquois | 0.0 /100 | #304 | Tragic 62.2% |
| Bermudans | 0.0 /100 | #305 | Tragic 62.2% |
| Africans | 0.0 /100 | #306 | Tragic 62.1% |
| Immigrants | Norway | 0.0 /100 | #307 | Tragic 62.1% |
| Chippewa | 0.0 /100 | #308 | Tragic 62.1% |
| Sub-Saharan Africans | 0.0 /100 | #309 | Tragic 62.1% |
| Immigrants | Liberia | 0.0 /100 | #310 | Tragic 62.0% |
| Immigrants | Morocco | 0.0 /100 | #311 | Tragic 62.0% |
| Immigrants | Latvia | 0.0 /100 | #312 | Tragic 62.0% |
| Liberians | 0.0 /100 | #313 | Tragic 62.0% |
| Immigrants | Cabo Verde | 0.0 /100 | #314 | Tragic 61.9% |
| Moroccans | 0.0 /100 | #315 | Tragic 61.9% |
| Immigrants | Middle Africa | 0.0 /100 | #316 | Tragic 61.9% |
| Immigrants | Bosnia and Herzegovina | 0.0 /100 | #317 | Tragic 61.9% |
| Alaskan Athabascans | 0.0 /100 | #318 | Tragic 61.8% |
Demographics Similar to Immigrants from Fiji by Family Households
In terms of family households, the demographic groups most similar to Immigrants from Fiji are Mexican (69.0%, a difference of 0.32%), Immigrants from Mexico (69.1%, a difference of 0.53%), Native Hawaiian (68.4%, a difference of 0.56%), Immigrants from Philippines (68.3%, a difference of 0.63%), and Immigrants from Central America (68.3%, a difference of 0.70%).
| Demographics | Rating | Rank | Family Households |
| Yup'ik | 100 /100 | #1 | Exceptional 72.4% |
| Spanish American Indians | 100.0 /100 | #2 | Exceptional 71.2% |
| Tongans | 100.0 /100 | #3 | Exceptional 69.6% |
| Yakama | 100.0 /100 | #4 | Exceptional 69.3% |
| Yuman | 100.0 /100 | #5 | Exceptional 69.3% |
| Immigrants | Mexico | 100.0 /100 | #6 | Exceptional 69.1% |
| Mexicans | 100.0 /100 | #7 | Exceptional 69.0% |
| Immigrants | Fiji | 100.0 /100 | #8 | Exceptional 68.8% |
| Native Hawaiians | 100.0 /100 | #9 | Exceptional 68.4% |
| Immigrants | Philippines | 100.0 /100 | #10 | Exceptional 68.3% |
| Immigrants | Central America | 100.0 /100 | #11 | Exceptional 68.3% |
| Koreans | 100.0 /100 | #12 | Exceptional 68.3% |
| Pueblo | 100.0 /100 | #13 | Exceptional 68.2% |
| Immigrants | Cuba | 100.0 /100 | #14 | Exceptional 68.2% |
| Assyrians/Chaldeans/Syriacs | 100.0 /100 | #15 | Exceptional 68.2% |