Aleut vs Immigrants from Fiji Family Households

COMPARE

Aleut
Race
Ancestry
AfghanAfricanAlaska NativeAlaskan AthabascanAlbanianAleutAlsatianAmericanApacheArabArapahoArgentineanArmenianAssyrian/Chaldean/SyriacAustralianAustrianBahamianBangladeshiBarbadianBasqueBelgianBelizeanBermudanBhutaneseBlackfeetBolivianBrazilianBritishBritish West IndianBulgarianBurmeseCajunCambodianCanadianCape VerdeanCarpatho RusynCelticCentral AmericanCentral American IndianCherokeeCheyenneChickasawChileanChineseChippewaChoctawColombianColvilleComancheCosta RicanCreeCreekCroatianCrowCubanCypriotCzechCzechoslovakianDanishDelawareDominicanDutchDutch West IndianEastern EuropeanEcuadorianEgyptianEnglishEstonianEthiopianEuropeanFijianFilipinoFinnishFrenchFrench American IndianFrench CanadianGermanGerman RussianGhanaianGreekGuamanian/ChamorroGuatemalanGuyaneseHaitianHmongHonduranHopiHoumaHungarianIcelanderIndian (Asian)IndonesianInupiatIranianIraqiIrishIroquoisIsraeliItalianJamaicanJapaneseJordanianKenyanKiowaKoreanLaotianLatvianLebaneseLiberianLithuanianLumbeeLuxembourgerMacedonianMalaysianMalteseMarshalleseMenomineeMexicanMexican American IndianMongolianMoroccanNative HawaiianNavajoNepaleseNew ZealanderNicaraguanNigerianNorthern EuropeanNorwegianOkinawanOsageOttawaPaiutePakistaniPalestinianPanamanianParaguayanPennsylvania GermanPeruvianPimaPolishPortuguesePotawatomiPuebloPuerto RicanPuget Sound SalishRomanianRussianSalvadoranSamoanScandinavianScotch-IrishScottishSeminoleSenegaleseSerbianShoshoneSierra LeoneanSiouxSlavicSlovakSloveneSomaliSouth AfricanSouth AmericanSouth American IndianSoviet UnionSpaniardSpanishSpanish AmericanSpanish American IndianSri LankanSubsaharan AfricanSudaneseSwedishSwissSyrianTaiwaneseThaiTlingit-HaidaTohono O'OdhamTonganTrinidadian and TobagonianTsimshianTurkishU.S. Virgin IslanderUgandanUkrainianUruguayanUteVenezuelanVietnameseWelshWest IndianYakamaYaquiYugoslavianYumanYup'ikZimbabwean
Immigration
NonimmigrantsImmigrantsAfghanistanAfricaAlbaniaArgentinaArmeniaAsiaAustraliaAustriaBahamasBangladeshBarbadosBelarusBelgiumBelizeBoliviaBosnia and HerzegovinaBrazilBulgariaBurma/MyanmarCabo VerdeCambodiaCameroonCanadaCaribbeanCentral AmericaChileChinaColombiaCongoCosta RicaCroatiaCubaCzechoslovakiaDenmarkDominicaDominican RepublicEastern AfricaEastern AsiaEastern EuropeEcuadorEgyptEl SalvadorEnglandEritreaEthiopiaEuropeFranceGermanyGhanaGreeceGrenadaGuatemalaGuyanaHaitiHondurasHong KongHungaryIndiaIndonesiaIranIraqIrelandIsraelItalyJamaicaJapanJordanKazakhstanKenyaKoreaKuwaitLaosLatin AmericaLatviaLebanonLiberiaLithuaniaMalaysiaMexicoMicronesiaMiddle AfricaMoldovaMoroccoNepalNetherlandsNicaraguaNigeriaNorth AmericaNorth MacedoniaNorthern AfricaNorthern EuropeNorwayOceaniaPakistanPanamaPeruPhilippinesPolandPortugalRomaniaRussiaSaudi ArabiaScotlandSenegalSerbiaSierra LeoneSingaporeSomaliaSouth AfricaSouth AmericaSouth Central AsiaSouth Eastern AsiaSouthern EuropeSpainSri LankaSt. Vincent and the GrenadinesSudanSwedenSwitzerlandSyriaTaiwanThailandTrinidad and TobagoTurkeyUgandaUkraineUruguayUzbekistanVenezuelaVietnamWest IndiesWestern AfricaWestern AsiaWestern EuropeYemenZaireZimbabweAzores
Immigrants from Fiji
Race
Ancestry
AfghanAfricanAlaska NativeAlaskan AthabascanAlbanianAlsatianAmericanApacheArabArapahoArgentineanArmenianAssyrian/Chaldean/SyriacAustralianAustrianBahamianBangladeshiBarbadianBasqueBelgianBelizeanBermudanBhutaneseBlackfeetBolivianBrazilianBritishBritish West IndianBulgarianBurmeseCajunCambodianCanadianCape VerdeanCarpatho RusynCelticCentral AmericanCentral American IndianCherokeeCheyenneChickasawChileanChineseChippewaChoctawColombianColvilleComancheCosta RicanCreeCreekCroatianCrowCubanCypriotCzechCzechoslovakianDanishDelawareDominicanDutchDutch West IndianEastern EuropeanEcuadorianEgyptianEnglishEstonianEthiopianEuropeanFijianFilipinoFinnishFrenchFrench American IndianFrench CanadianGermanGerman RussianGhanaianGreekGuamanian/ChamorroGuatemalanGuyaneseHaitianHmongHonduranHopiHoumaHungarianIcelanderIndian (Asian)IndonesianInupiatIranianIraqiIrishIroquoisIsraeliItalianJamaicanJapaneseJordanianKenyanKiowaKoreanLaotianLatvianLebaneseLiberianLithuanianLumbeeLuxembourgerMacedonianMalaysianMalteseMarshalleseMenomineeMexicanMexican American IndianMongolianMoroccanNative HawaiianNavajoNepaleseNew ZealanderNicaraguanNigerianNorthern EuropeanNorwegianOkinawanOsageOttawaPaiutePakistaniPalestinianPanamanianParaguayanPennsylvania GermanPeruvianPimaPolishPortuguesePotawatomiPuebloPuerto RicanPuget Sound SalishRomanianRussianSalvadoranSamoanScandinavianScotch-IrishScottishSeminoleSenegaleseSerbianShoshoneSierra LeoneanSiouxSlavicSlovakSloveneSomaliSouth AfricanSouth AmericanSouth American IndianSoviet UnionSpaniardSpanishSpanish AmericanSpanish American IndianSri LankanSubsaharan AfricanSudaneseSwedishSwissSyrianTaiwaneseThaiTlingit-HaidaTohono O'OdhamTonganTrinidadian and TobagonianTsimshianTurkishU.S. Virgin IslanderUgandanUkrainianUruguayanUteVenezuelanVietnameseWelshWest IndianYakamaYaquiYugoslavianYumanYup'ikZimbabwean
Immigration
NonimmigrantsImmigrantsAfghanistanAfricaAlbaniaArgentinaArmeniaAsiaAustraliaAustriaBahamasBangladeshBarbadosBelarusBelgiumBelizeBoliviaBosnia and HerzegovinaBrazilBulgariaBurma/MyanmarCabo VerdeCambodiaCameroonCanadaCaribbeanCentral AmericaChileChinaColombiaCongoCosta RicaCroatiaCubaCzechoslovakiaDenmarkDominicaDominican RepublicEastern AfricaEastern AsiaEastern EuropeEcuadorEgyptEl SalvadorEnglandEritreaEthiopiaEuropeFijiFranceGermanyGhanaGreeceGrenadaGuatemalaGuyanaHaitiHondurasHong KongHungaryIndiaIndonesiaIranIraqIrelandIsraelItalyJamaicaJapanJordanKazakhstanKenyaKoreaKuwaitLaosLatin AmericaLatviaLebanonLiberiaLithuaniaMalaysiaMexicoMicronesiaMiddle AfricaMoldovaMoroccoNepalNetherlandsNicaraguaNigeriaNorth AmericaNorth MacedoniaNorthern AfricaNorthern EuropeNorwayOceaniaPakistanPanamaPeruPhilippinesPolandPortugalRomaniaRussiaSaudi ArabiaScotlandSenegalSerbiaSierra LeoneSingaporeSomaliaSouth AfricaSouth AmericaSouth Central AsiaSouth Eastern AsiaSouthern EuropeSpainSri LankaSt. Vincent and the GrenadinesSudanSwedenSwitzerlandSyriaTaiwanThailandTrinidad and TobagoTurkeyUgandaUkraineUruguayUzbekistanVenezuelaVietnamWest IndiesWestern AfricaWestern AsiaWestern EuropeYemenZaireZimbabweAzores
Family Households
Income
Poverty
Unemployment
Labor Participation
Family Structure
Vehicle Availability
Education Level
Disability

Family Households Comparison

Aleuts

Immigrants from Fiji

Tragic
Exceptional
63.4%
FAMILY HOUSEHOLDS
1.9/ 100
METRIC RATING
239th/ 347
METRIC RANK
68.8%
FAMILY HOUSEHOLDS
100.0/ 100
METRIC RATING
8th/ 347
METRIC RANK

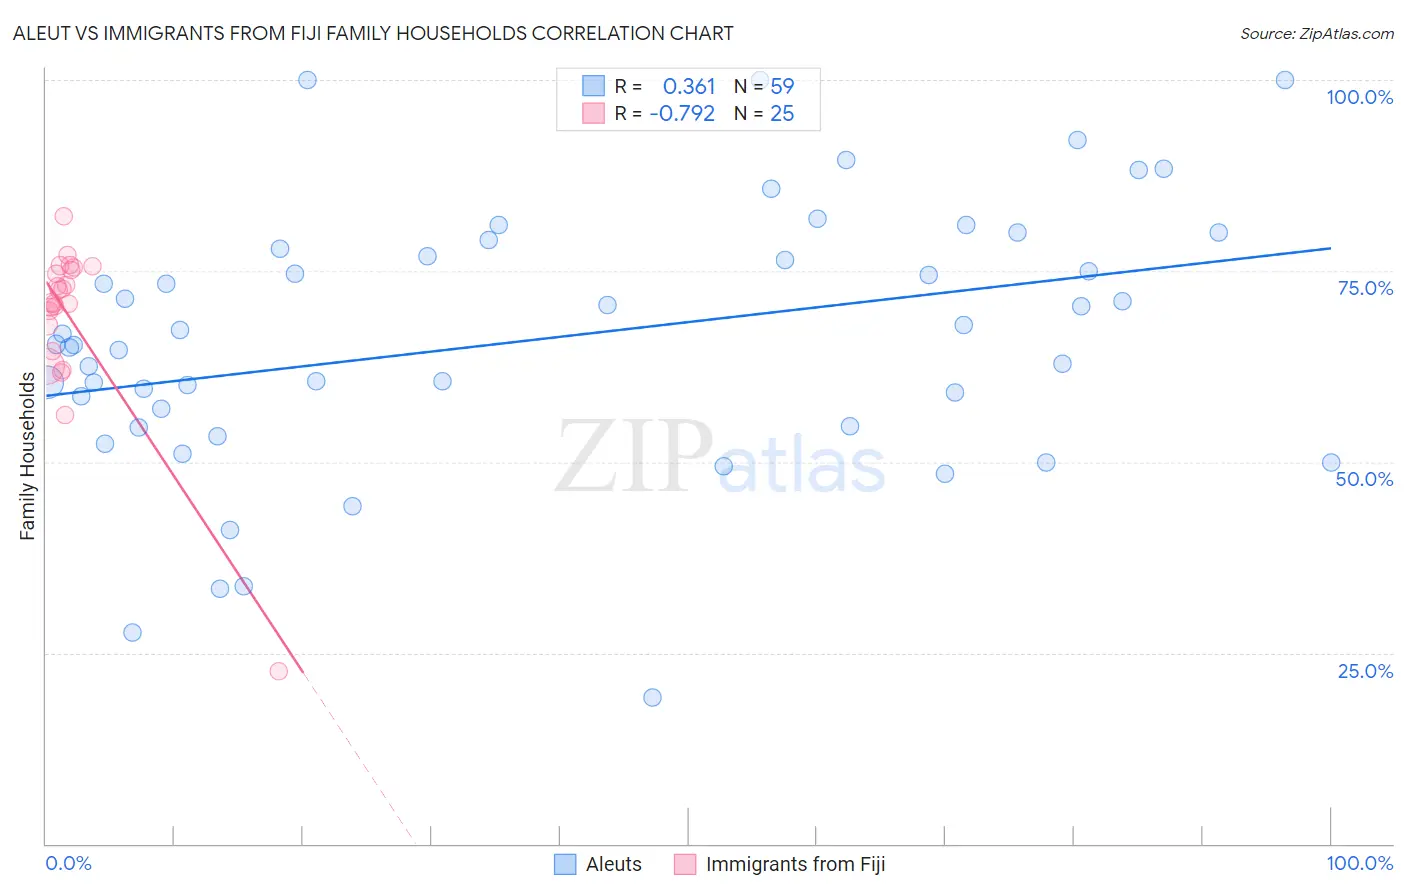
Aleut vs Immigrants from Fiji Family Households Correlation Chart

The statistical analysis conducted on geographies consisting of 61,774,066 people shows a mild positive correlation between the proportion of Aleuts and percentage of family households in the United States with a correlation coefficient (R) of 0.361 and weighted average of 63.4%. Similarly, the statistical analysis conducted on geographies consisting of 93,754,900 people shows a strong negative correlation between the proportion of Immigrants from Fiji and percentage of family households in the United States with a correlation coefficient (R) of -0.792 and weighted average of 68.8%, a difference of 8.4%.
Aleut vs Immigrants from Fiji Family Households

Family Households Correlation Summary

MeasurementAleutImmigrants from Fiji
Minimum19.2%22.7%
Maximum100.0%82.1%
Range80.8%59.5%
Mean66.1%68.9%
Median65.4%70.8%
Interquartile 25% (IQ1)54.7%66.2%
Interquartile 75% (IQ3)77.9%75.3%
Interquartile Range (IQR)23.2%9.0%
Standard Deviation (Sample)17.3%11.2%
Standard Deviation (Population)17.2%11.0%

Similar Demographics by Family Households

Demographics Similar to Aleuts by Family Households

In terms of family households, the demographic groups most similar to Aleuts are South African (63.4%, a difference of 0.0%), Immigrants from St. Vincent and the Grenadines (63.4%, a difference of 0.010%), Immigrants from Israel (63.4%, a difference of 0.010%), Comanche (63.5%, a difference of 0.030%), and Immigrants from Zimbabwe (63.5%, a difference of 0.030%).
DemographicsRating | RankFamily Households
Immigrants | Northern Africa
2.6
/100
|
#232
Tragic
63.5%
Immigrants | Armenia
2.6
/100
|
#233
Tragic
63.5%
Finns
2.3
/100
|
#234
Tragic
63.5%
Albanians
2.2
/100
|
#235
Tragic
63.5%
Ghanaians
2.1
/100
|
#236
Tragic
63.5%
Comanche
2.1
/100
|
#237
Tragic
63.5%
Immigrants | Zimbabwe
2.0
/100
|
#238
Tragic
63.5%
Aleuts
1.9
/100
|
#239
Tragic
63.4%
South Africans
1.9
/100
|
#240
Tragic
63.4%
Immigrants | St. Vincent and the Grenadines
1.9
/100
|
#241
Tragic
63.4%
Immigrants | Israel
1.8
/100
|
#242
Tragic
63.4%
Immigrants | Czechoslovakia
1.8
/100
|
#243
Tragic
63.4%
Eastern Europeans
1.6
/100
|
#244
Tragic
63.4%
Immigrants | Dominica
1.6
/100
|
#245
Tragic
63.4%
Immigrants | Ghana
1.6
/100
|
#246
Tragic
63.4%

Demographics Similar to Immigrants from Fiji by Family Households

In terms of family households, the demographic groups most similar to Immigrants from Fiji are Mexican (69.0%, a difference of 0.32%), Immigrants from Mexico (69.1%, a difference of 0.53%), Native Hawaiian (68.4%, a difference of 0.56%), Immigrants from Philippines (68.3%, a difference of 0.63%), and Immigrants from Central America (68.3%, a difference of 0.70%).
DemographicsRating | RankFamily Households
Yup'ik
100
/100
|
#1
Exceptional
72.4%
Spanish American Indians
100.0
/100
|
#2
Exceptional
71.2%
Tongans
100.0
/100
|
#3
Exceptional
69.6%
Yakama
100.0
/100
|
#4
Exceptional
69.3%
Yuman
100.0
/100
|
#5
Exceptional
69.3%
Immigrants | Mexico
100.0
/100
|
#6
Exceptional
69.1%
Mexicans
100.0
/100
|
#7
Exceptional
69.0%
Immigrants | Fiji
100.0
/100
|
#8
Exceptional
68.8%
Native Hawaiians
100.0
/100
|
#9
Exceptional
68.4%
Immigrants | Philippines
100.0
/100
|
#10
Exceptional
68.3%
Immigrants | Central America
100.0
/100
|
#11
Exceptional
68.3%
Koreans
100.0
/100
|
#12
Exceptional
68.3%
Pueblo
100.0
/100
|
#13
Exceptional
68.2%
Immigrants | Cuba
100.0
/100
|
#14
Exceptional
68.2%
Assyrians/Chaldeans/Syriacs
100.0
/100
|
#15
Exceptional
68.2%