Tlingit-Haida vs Laotian Family Households
COMPARE
Tlingit-Haida
Laotian
Family Households
Family Households Comparison
Tlingit-Haida
Laotians
61.6%
FAMILY HOUSEHOLDS
0.0/ 100
METRIC RATING
323rd/ 347
METRIC RANK
65.8%
FAMILY HOUSEHOLDS
99.9/ 100
METRIC RATING
73rd/ 347
METRIC RANK
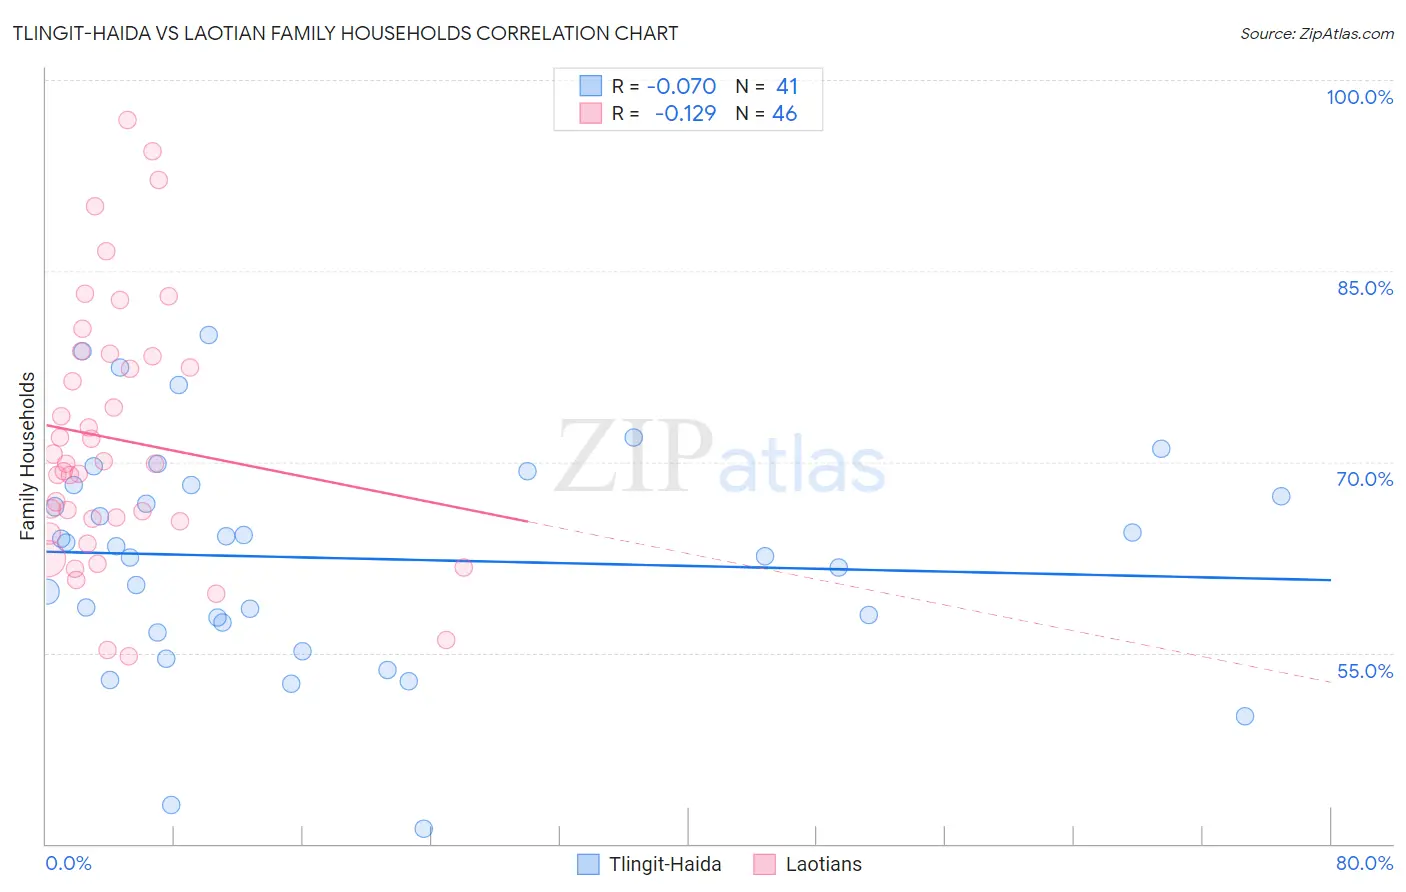
Tlingit-Haida vs Laotian Family Households Correlation Chart
The statistical analysis conducted on geographies consisting of 60,855,548 people shows a slight negative correlation between the proportion of Tlingit-Haida and percentage of family households in the United States with a correlation coefficient (R) of -0.070 and weighted average of 61.6%. Similarly, the statistical analysis conducted on geographies consisting of 224,743,344 people shows a poor negative correlation between the proportion of Laotians and percentage of family households in the United States with a correlation coefficient (R) of -0.129 and weighted average of 65.8%, a difference of 6.8%.
Family Households Correlation Summary
| Measurement | Tlingit-Haida | Laotian |
| Minimum | 41.2% | 54.7% |
| Maximum | 80.0% | 96.9% |
| Range | 38.8% | 42.1% |
| Mean | 62.4% | 71.8% |
| Median | 63.4% | 69.9% |
| Interquartile 25% (IQ1) | 57.0% | 65.4% |
| Interquartile 75% (IQ3) | 68.2% | 78.3% |
| Interquartile Range (IQR) | 11.2% | 12.9% |
| Standard Deviation (Sample) | 8.7% | 10.2% |
| Standard Deviation (Population) | 8.6% | 10.1% |
Similar Demographics by Family Households
Demographics Similar to Tlingit-Haida by Family Households
In terms of family households, the demographic groups most similar to Tlingit-Haida are Immigrants from Serbia (61.6%, a difference of 0.010%), Immigrants from West Indies (61.6%, a difference of 0.010%), Immigrants from Switzerland (61.6%, a difference of 0.020%), Alsatian (61.7%, a difference of 0.10%), and Ugandan (61.7%, a difference of 0.15%).
| Demographics | Rating | Rank | Family Households |
| Immigrants | Middle Africa | 0.0 /100 | #316 | Tragic 61.9% |
| Immigrants | Bosnia and Herzegovina | 0.0 /100 | #317 | Tragic 61.9% |
| Alaskan Athabascans | 0.0 /100 | #318 | Tragic 61.8% |
| Cape Verdeans | 0.0 /100 | #319 | Tragic 61.8% |
| Ugandans | 0.0 /100 | #320 | Tragic 61.7% |
| Alsatians | 0.0 /100 | #321 | Tragic 61.7% |
| Immigrants | Serbia | 0.0 /100 | #322 | Tragic 61.6% |
| Tlingit-Haida | 0.0 /100 | #323 | Tragic 61.6% |
| Immigrants | West Indies | 0.0 /100 | #324 | Tragic 61.6% |
| Immigrants | Switzerland | 0.0 /100 | #325 | Tragic 61.6% |
| Indonesians | 0.0 /100 | #326 | Tragic 61.5% |
| Blacks/African Americans | 0.0 /100 | #327 | Tragic 61.5% |
| Kiowa | 0.0 /100 | #328 | Tragic 61.4% |
| Cambodians | 0.0 /100 | #329 | Tragic 61.4% |
| Immigrants | Australia | 0.0 /100 | #330 | Tragic 61.3% |
Demographics Similar to Laotians by Family Households
In terms of family households, the demographic groups most similar to Laotians are Burmese (65.7%, a difference of 0.040%), Portuguese (65.8%, a difference of 0.080%), Houma (65.7%, a difference of 0.090%), Bhutanese (65.9%, a difference of 0.13%), and Malaysian (65.9%, a difference of 0.15%).
| Demographics | Rating | Rank | Family Households |
| Fijians | 99.9 /100 | #66 | Exceptional 65.9% |
| Filipinos | 99.9 /100 | #67 | Exceptional 65.9% |
| Japanese | 99.9 /100 | #68 | Exceptional 65.9% |
| Malaysians | 99.9 /100 | #69 | Exceptional 65.9% |
| Immigrants | Afghanistan | 99.9 /100 | #70 | Exceptional 65.9% |
| Bhutanese | 99.9 /100 | #71 | Exceptional 65.9% |
| Portuguese | 99.9 /100 | #72 | Exceptional 65.8% |
| Laotians | 99.9 /100 | #73 | Exceptional 65.8% |
| Burmese | 99.9 /100 | #74 | Exceptional 65.7% |
| Houma | 99.9 /100 | #75 | Exceptional 65.7% |
| Immigrants | Azores | 99.8 /100 | #76 | Exceptional 65.6% |
| Immigrants | South America | 99.8 /100 | #77 | Exceptional 65.6% |
| Yaqui | 99.8 /100 | #78 | Exceptional 65.6% |
| Immigrants | Costa Rica | 99.8 /100 | #79 | Exceptional 65.6% |
| Puget Sound Salish | 99.8 /100 | #80 | Exceptional 65.6% |