Arab vs Immigrants from Cabo Verde Average Family Size
COMPARE
Arab
Immigrants from Cabo Verde
Average Family Size
Average Family Size Comparison
Arabs
Immigrants from Cabo Verde
3.23
AVERAGE FAMILY SIZE
53.8/ 100
METRIC RATING
170th/ 347
METRIC RANK
3.20
AVERAGE FAMILY SIZE
16.0/ 100
METRIC RATING
206th/ 347
METRIC RANK
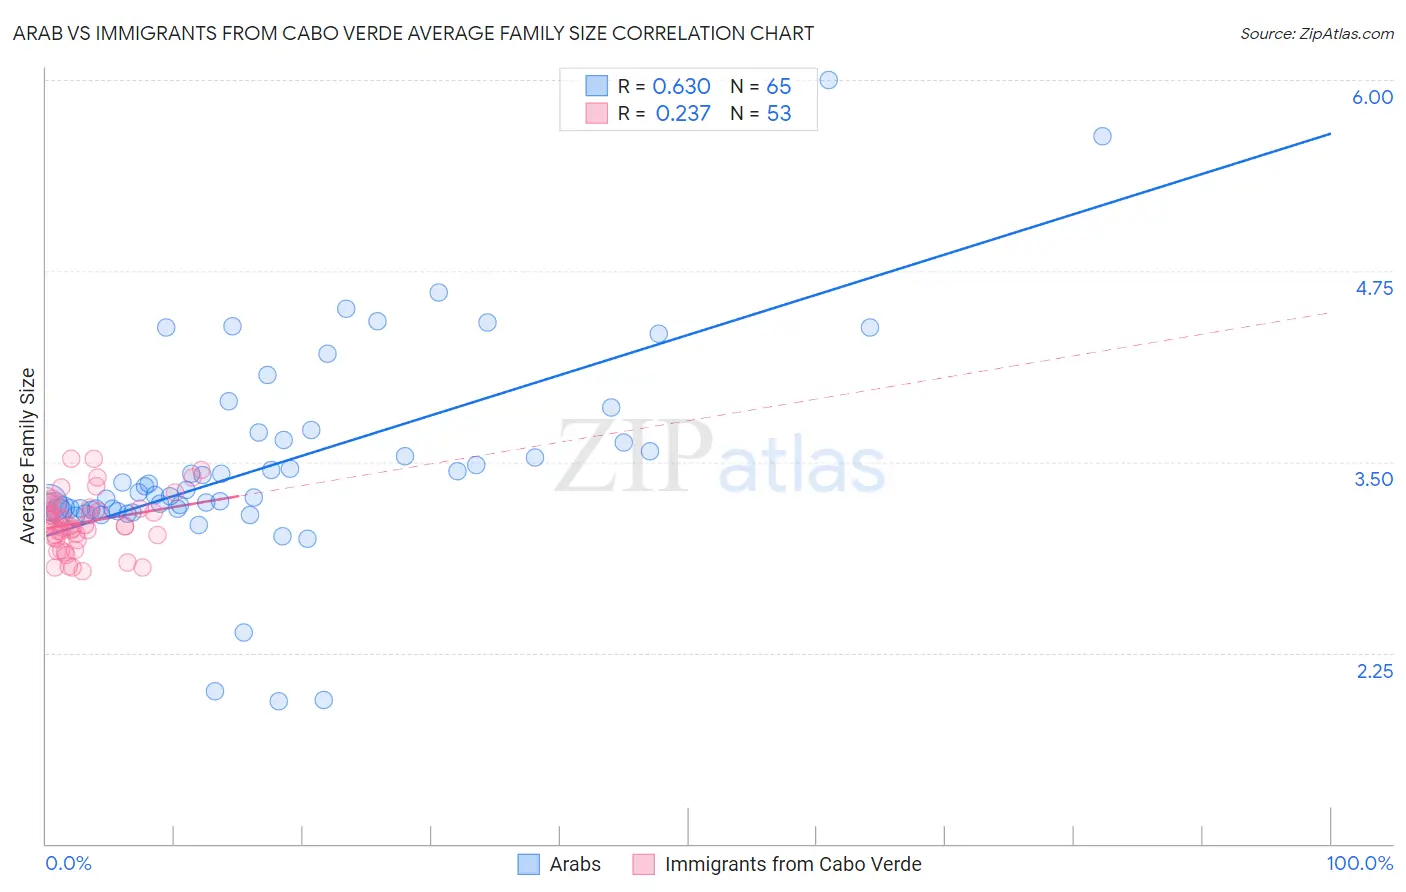
Arab vs Immigrants from Cabo Verde Average Family Size Correlation Chart
The statistical analysis conducted on geographies consisting of 486,389,490 people shows a significant positive correlation between the proportion of Arabs and average family size in the United States with a correlation coefficient (R) of 0.630 and weighted average of 3.23. Similarly, the statistical analysis conducted on geographies consisting of 38,135,369 people shows a weak positive correlation between the proportion of Immigrants from Cabo Verde and average family size in the United States with a correlation coefficient (R) of 0.237 and weighted average of 3.20, a difference of 0.83%.
Average Family Size Correlation Summary
| Measurement | Arab | Immigrants from Cabo Verde |
| Minimum | 1.93 | 2.78 |
| Maximum | 6.00 | 3.52 |
| Range | 4.07 | 0.74 |
| Mean | 3.49 | 3.10 |
| Median | 3.30 | 3.08 |
| Interquartile 25% (IQ1) | 3.19 | 3.00 |
| Interquartile 75% (IQ3) | 3.67 | 3.21 |
| Interquartile Range (IQR) | 0.48 | 0.21 |
| Standard Deviation (Sample) | 0.69 | 0.18 |
| Standard Deviation (Population) | 0.68 | 0.18 |
Similar Demographics by Average Family Size
Demographics Similar to Arabs by Average Family Size
In terms of average family size, the demographic groups most similar to Arabs are Taiwanese (3.23, a difference of 0.010%), Aleut (3.23, a difference of 0.010%), Chilean (3.23, a difference of 0.010%), Immigrants from Congo (3.23, a difference of 0.020%), and Immigrants from Uruguay (3.23, a difference of 0.030%).
| Demographics | Rating | Rank | Average Family Size |
| Uruguayans | 58.8 /100 | #163 | Average 3.23 |
| Egyptians | 58.6 /100 | #164 | Average 3.23 |
| Ugandans | 58.4 /100 | #165 | Average 3.23 |
| Immigrants | Senegal | 57.5 /100 | #166 | Average 3.23 |
| Dutch West Indians | 56.9 /100 | #167 | Average 3.23 |
| Taiwanese | 54.2 /100 | #168 | Average 3.23 |
| Aleuts | 54.1 /100 | #169 | Average 3.23 |
| Arabs | 53.8 /100 | #170 | Average 3.23 |
| Chileans | 53.2 /100 | #171 | Average 3.23 |
| Immigrants | Congo | 52.7 /100 | #172 | Average 3.23 |
| Immigrants | Uruguay | 52.0 /100 | #173 | Average 3.23 |
| Immigrants | South Central Asia | 50.0 /100 | #174 | Average 3.23 |
| Immigrants | China | 49.9 /100 | #175 | Average 3.23 |
| Israelis | 48.7 /100 | #176 | Average 3.23 |
| Argentineans | 47.4 /100 | #177 | Average 3.23 |
Demographics Similar to Immigrants from Cabo Verde by Average Family Size
In terms of average family size, the demographic groups most similar to Immigrants from Cabo Verde are Paraguayan (3.20, a difference of 0.010%), Immigrants from Poland (3.20, a difference of 0.020%), Immigrants from Nepal (3.21, a difference of 0.070%), Immigrants from Morocco (3.21, a difference of 0.080%), and Immigrants from India (3.21, a difference of 0.080%).
| Demographics | Rating | Rank | Average Family Size |
| Hmong | 20.7 /100 | #199 | Fair 3.21 |
| Immigrants | Kenya | 19.2 /100 | #200 | Poor 3.21 |
| Immigrants | Morocco | 18.5 /100 | #201 | Poor 3.21 |
| Immigrants | India | 18.5 /100 | #202 | Poor 3.21 |
| Immigrants | Nepal | 18.1 /100 | #203 | Poor 3.21 |
| Immigrants | Poland | 16.6 /100 | #204 | Poor 3.20 |
| Paraguayans | 16.3 /100 | #205 | Poor 3.20 |
| Immigrants | Cabo Verde | 16.0 /100 | #206 | Poor 3.20 |
| Filipinos | 13.6 /100 | #207 | Poor 3.20 |
| Chippewa | 13.3 /100 | #208 | Poor 3.20 |
| Sudanese | 13.3 /100 | #209 | Poor 3.20 |
| Zimbabweans | 12.6 /100 | #210 | Poor 3.20 |
| Immigrants | Iran | 12.1 /100 | #211 | Poor 3.20 |
| Creek | 12.1 /100 | #212 | Poor 3.20 |
| Mongolians | 11.5 /100 | #213 | Poor 3.20 |