Tlingit-Haida vs Immigrants from Cabo Verde Doctorate Degree
COMPARE
Tlingit-Haida
Immigrants from Cabo Verde
Doctorate Degree
Doctorate Degree Comparison
Tlingit-Haida
Immigrants from Cabo Verde
1.7%
DOCTORATE DEGREE
11.9/ 100
METRIC RATING
218th/ 347
METRIC RANK
1.3%
DOCTORATE DEGREE
0.0/ 100
METRIC RATING
326th/ 347
METRIC RANK
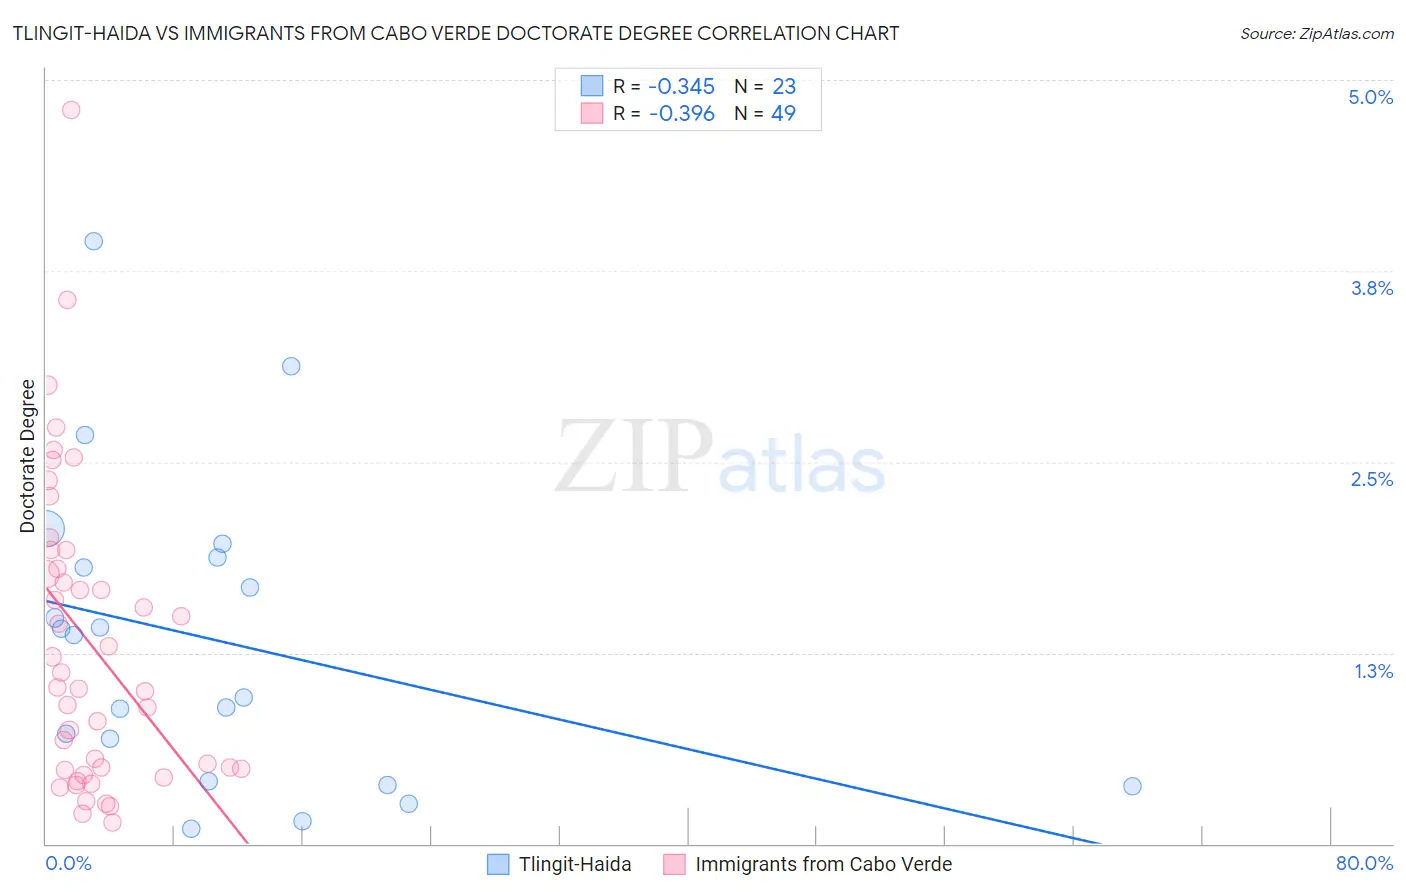
Tlingit-Haida vs Immigrants from Cabo Verde Doctorate Degree Correlation Chart
The statistical analysis conducted on geographies consisting of 60,593,373 people shows a mild negative correlation between the proportion of Tlingit-Haida and percentage of population with at least doctorate degree education in the United States with a correlation coefficient (R) of -0.345 and weighted average of 1.7%. Similarly, the statistical analysis conducted on geographies consisting of 38,072,290 people shows a mild negative correlation between the proportion of Immigrants from Cabo Verde and percentage of population with at least doctorate degree education in the United States with a correlation coefficient (R) of -0.396 and weighted average of 1.3%, a difference of 29.2%.
Doctorate Degree Correlation Summary
| Measurement | Tlingit-Haida | Immigrants from Cabo Verde |
| Minimum | 0.099% | 0.14% |
| Maximum | 3.9% | 4.8% |
| Range | 3.8% | 4.7% |
| Mean | 1.3% | 1.3% |
| Median | 1.4% | 1.0% |
| Interquartile 25% (IQ1) | 0.41% | 0.49% |
| Interquartile 75% (IQ3) | 1.9% | 1.9% |
| Interquartile Range (IQR) | 1.5% | 1.4% |
| Standard Deviation (Sample) | 0.99% | 0.99% |
| Standard Deviation (Population) | 0.97% | 0.98% |
Similar Demographics by Doctorate Degree
Demographics Similar to Tlingit-Haida by Doctorate Degree
In terms of doctorate degree, the demographic groups most similar to Tlingit-Haida are Spanish American (1.7%, a difference of 0.37%), Immigrants from Iraq (1.7%, a difference of 0.46%), Immigrants from Burma/Myanmar (1.7%, a difference of 0.58%), Alaskan Athabascan (1.7%, a difference of 0.68%), and Pueblo (1.7%, a difference of 0.82%).
| Demographics | Rating | Rank | Doctorate Degree |
| Immigrants | Armenia | 15.1 /100 | #211 | Poor 1.7% |
| Immigrants | South Eastern Asia | 14.7 /100 | #212 | Poor 1.7% |
| Koreans | 14.2 /100 | #213 | Poor 1.7% |
| Pueblo | 14.2 /100 | #214 | Poor 1.7% |
| Alaskan Athabascans | 13.8 /100 | #215 | Poor 1.7% |
| Immigrants | Burma/Myanmar | 13.5 /100 | #216 | Poor 1.7% |
| Spanish Americans | 12.9 /100 | #217 | Poor 1.7% |
| Tlingit-Haida | 11.9 /100 | #218 | Poor 1.7% |
| Immigrants | Iraq | 10.7 /100 | #219 | Poor 1.7% |
| Immigrants | Uruguay | 9.2 /100 | #220 | Tragic 1.7% |
| Immigrants | Nonimmigrants | 8.8 /100 | #221 | Tragic 1.7% |
| Immigrants | Venezuela | 8.7 /100 | #222 | Tragic 1.7% |
| Immigrants | Bosnia and Herzegovina | 7.8 /100 | #223 | Tragic 1.7% |
| Immigrants | Poland | 7.4 /100 | #224 | Tragic 1.7% |
| Immigrants | Colombia | 6.7 /100 | #225 | Tragic 1.7% |
Demographics Similar to Immigrants from Cabo Verde by Doctorate Degree
In terms of doctorate degree, the demographic groups most similar to Immigrants from Cabo Verde are Pima (1.3%, a difference of 0.020%), Hispanic or Latino (1.3%, a difference of 0.29%), Native/Alaskan (1.3%, a difference of 0.41%), Immigrants from Belize (1.3%, a difference of 0.74%), and Inupiat (1.3%, a difference of 0.87%).
| Demographics | Rating | Rank | Doctorate Degree |
| Immigrants | Guyana | 0.1 /100 | #319 | Tragic 1.3% |
| Immigrants | St. Vincent and the Grenadines | 0.1 /100 | #320 | Tragic 1.3% |
| Dutch West Indians | 0.1 /100 | #321 | Tragic 1.3% |
| Seminole | 0.1 /100 | #322 | Tragic 1.3% |
| Immigrants | Belize | 0.1 /100 | #323 | Tragic 1.3% |
| Natives/Alaskans | 0.0 /100 | #324 | Tragic 1.3% |
| Pima | 0.0 /100 | #325 | Tragic 1.3% |
| Immigrants | Cabo Verde | 0.0 /100 | #326 | Tragic 1.3% |
| Hispanics or Latinos | 0.0 /100 | #327 | Tragic 1.3% |
| Inupiat | 0.0 /100 | #328 | Tragic 1.3% |
| Haitians | 0.0 /100 | #329 | Tragic 1.3% |
| Yup'ik | 0.0 /100 | #330 | Tragic 1.3% |
| Immigrants | Latin America | 0.0 /100 | #331 | Tragic 1.3% |
| Yakama | 0.0 /100 | #332 | Tragic 1.3% |
| Immigrants | Caribbean | 0.0 /100 | #333 | Tragic 1.3% |