Sri Lankan vs Indian (Asian) Births to Unmarried Women
COMPARE
Sri Lankan
Indian (Asian)
Births to Unmarried Women
Births to Unmarried Women Comparison
Sri Lankans
Indians (Asian)
28.9%
BIRTHS TO UNMARRIED WOMEN
97.5/ 100
METRIC RATING
85th/ 347
METRIC RANK
25.3%
BIRTHS TO UNMARRIED WOMEN
100.0/ 100
METRIC RATING
12th/ 347
METRIC RANK
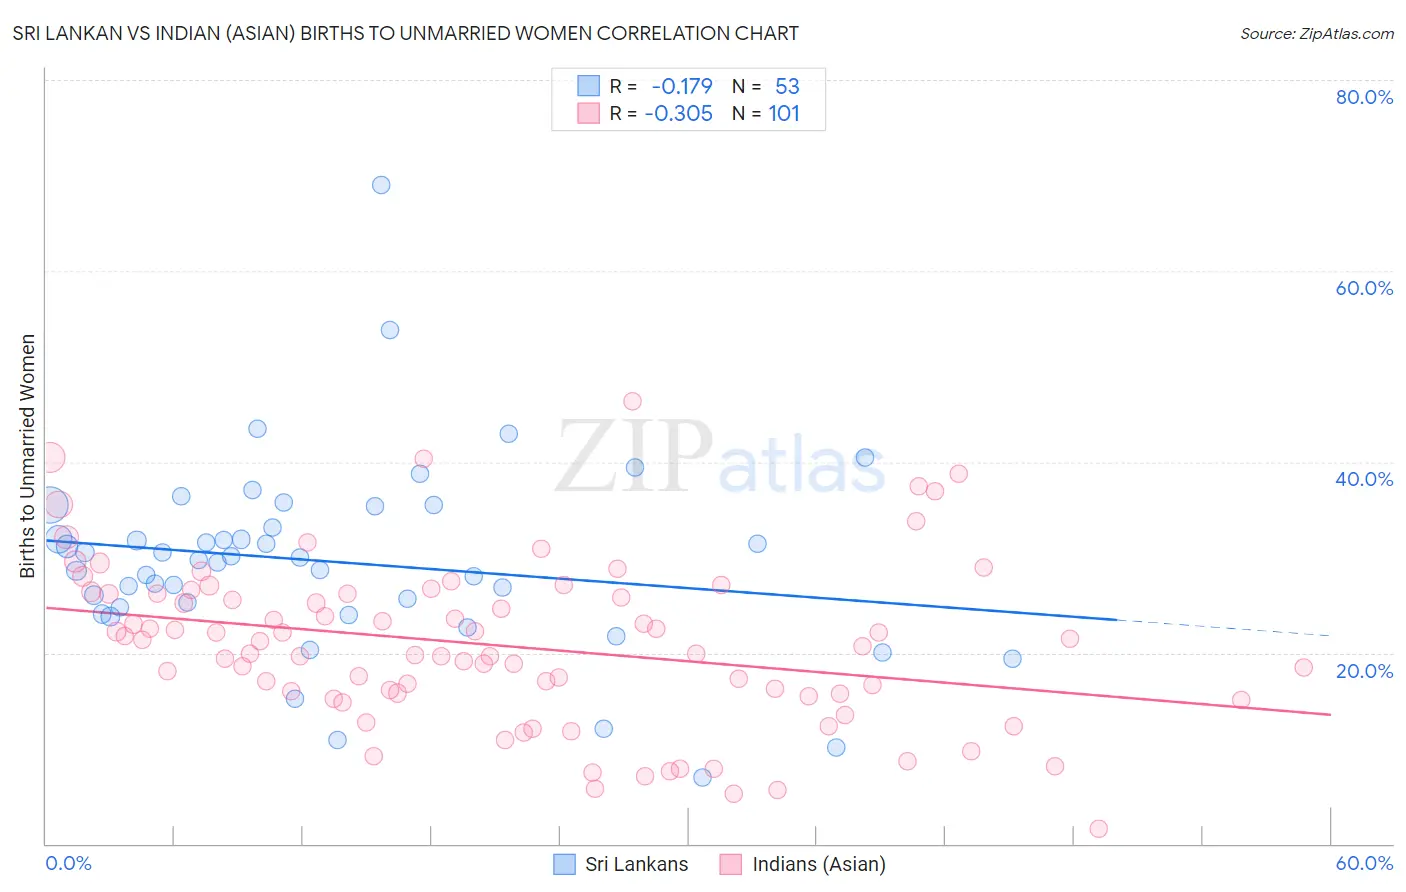
Sri Lankan vs Indian (Asian) Births to Unmarried Women Correlation Chart
The statistical analysis conducted on geographies consisting of 411,137,985 people shows a poor negative correlation between the proportion of Sri Lankans and percentage of births to unmarried women in the United States with a correlation coefficient (R) of -0.179 and weighted average of 28.9%. Similarly, the statistical analysis conducted on geographies consisting of 453,301,361 people shows a mild negative correlation between the proportion of Indians (Asian) and percentage of births to unmarried women in the United States with a correlation coefficient (R) of -0.305 and weighted average of 25.3%, a difference of 14.5%.
Births to Unmarried Women Correlation Summary
| Measurement | Sri Lankan | Indian (Asian) |
| Minimum | 6.9% | 1.6% |
| Maximum | 69.0% | 46.3% |
| Range | 62.1% | 44.7% |
| Mean | 29.5% | 20.7% |
| Median | 29.7% | 20.7% |
| Interquartile 25% (IQ1) | 24.4% | 15.5% |
| Interquartile 75% (IQ3) | 34.2% | 26.2% |
| Interquartile Range (IQR) | 9.8% | 10.7% |
| Standard Deviation (Sample) | 10.2% | 8.6% |
| Standard Deviation (Population) | 10.1% | 8.6% |
Similar Demographics by Births to Unmarried Women
Demographics Similar to Sri Lankans by Births to Unmarried Women
In terms of births to unmarried women, the demographic groups most similar to Sri Lankans are Immigrants from Jordan (29.0%, a difference of 0.070%), Taiwanese (29.0%, a difference of 0.15%), Immigrants from France (29.0%, a difference of 0.16%), Immigrants from Poland (28.9%, a difference of 0.17%), and Immigrants from Saudi Arabia (29.1%, a difference of 0.43%).
| Demographics | Rating | Rank | Births to Unmarried Women |
| Zimbabweans | 98.2 /100 | #78 | Exceptional 28.7% |
| Danes | 98.2 /100 | #79 | Exceptional 28.7% |
| Immigrants | Afghanistan | 98.1 /100 | #80 | Exceptional 28.7% |
| Immigrants | Austria | 98.1 /100 | #81 | Exceptional 28.7% |
| Romanians | 98.0 /100 | #82 | Exceptional 28.7% |
| Immigrants | Kuwait | 98.0 /100 | #83 | Exceptional 28.8% |
| Immigrants | Poland | 97.6 /100 | #84 | Exceptional 28.9% |
| Sri Lankans | 97.5 /100 | #85 | Exceptional 28.9% |
| Immigrants | Jordan | 97.4 /100 | #86 | Exceptional 29.0% |
| Taiwanese | 97.3 /100 | #87 | Exceptional 29.0% |
| Immigrants | France | 97.3 /100 | #88 | Exceptional 29.0% |
| Immigrants | Saudi Arabia | 97.0 /100 | #89 | Exceptional 29.1% |
| Immigrants | Latvia | 96.8 /100 | #90 | Exceptional 29.1% |
| Immigrants | Fiji | 96.6 /100 | #91 | Exceptional 29.2% |
| Arabs | 96.5 /100 | #92 | Exceptional 29.2% |
Demographics Similar to Indians (Asian) by Births to Unmarried Women
In terms of births to unmarried women, the demographic groups most similar to Indians (Asian) are Iranian (25.3%, a difference of 0.14%), Immigrants from Lebanon (25.3%, a difference of 0.26%), Immigrants from Israel (25.1%, a difference of 0.47%), Immigrants from Eastern Asia (25.0%, a difference of 0.90%), and Immigrants from Singapore (25.6%, a difference of 1.4%).
| Demographics | Rating | Rank | Births to Unmarried Women |
| Immigrants | Hong Kong | 100.0 /100 | #5 | Exceptional 23.6% |
| Immigrants | Iran | 100.0 /100 | #6 | Exceptional 24.0% |
| Thais | 100.0 /100 | #7 | Exceptional 24.0% |
| Immigrants | China | 100.0 /100 | #8 | Exceptional 24.7% |
| Immigrants | South Central Asia | 100.0 /100 | #9 | Exceptional 24.7% |
| Immigrants | Eastern Asia | 100.0 /100 | #10 | Exceptional 25.0% |
| Immigrants | Israel | 100.0 /100 | #11 | Exceptional 25.1% |
| Indians (Asian) | 100.0 /100 | #12 | Exceptional 25.3% |
| Iranians | 100.0 /100 | #13 | Exceptional 25.3% |
| Immigrants | Lebanon | 100.0 /100 | #14 | Exceptional 25.3% |
| Immigrants | Singapore | 100.0 /100 | #15 | Exceptional 25.6% |
| Immigrants | Belarus | 100.0 /100 | #16 | Exceptional 25.6% |
| Immigrants | Uzbekistan | 100.0 /100 | #17 | Exceptional 25.8% |
| Immigrants | Armenia | 99.9 /100 | #18 | Exceptional 26.1% |
| Armenians | 99.9 /100 | #19 | Exceptional 26.2% |