Sri Lankan vs White/Caucasian Family Households
COMPARE
Sri Lankan
White/Caucasian
Family Households
Family Households Comparison
Sri Lankans
Whites/Caucasians
67.7%
FAMILY HOUSEHOLDS
100.0/ 100
METRIC RATING
22nd/ 347
METRIC RANK
65.1%
FAMILY HOUSEHOLDS
97.3/ 100
METRIC RATING
106th/ 347
METRIC RANK
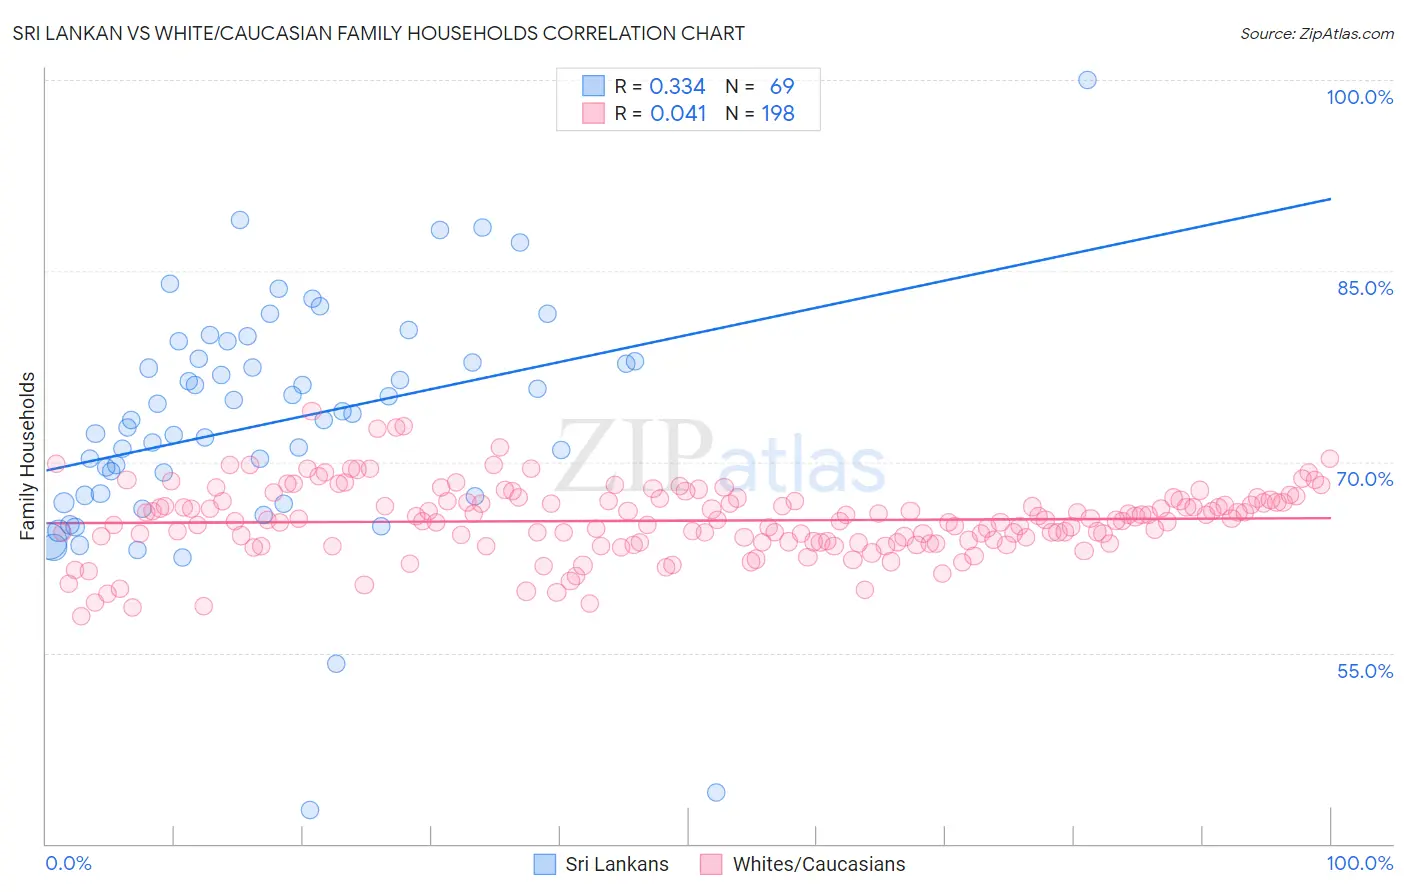
Sri Lankan vs White/Caucasian Family Households Correlation Chart
The statistical analysis conducted on geographies consisting of 440,096,493 people shows a mild positive correlation between the proportion of Sri Lankans and percentage of family households in the United States with a correlation coefficient (R) of 0.334 and weighted average of 67.7%. Similarly, the statistical analysis conducted on geographies consisting of 583,404,085 people shows no correlation between the proportion of Whites/Caucasians and percentage of family households in the United States with a correlation coefficient (R) of 0.041 and weighted average of 65.1%, a difference of 4.1%.
Family Households Correlation Summary
| Measurement | Sri Lankan | White/Caucasian |
| Minimum | 42.7% | 57.8% |
| Maximum | 100.0% | 73.9% |
| Range | 57.3% | 16.1% |
| Mean | 73.1% | 65.4% |
| Median | 73.3% | 65.4% |
| Interquartile 25% (IQ1) | 67.3% | 63.7% |
| Interquartile 75% (IQ3) | 78.0% | 66.9% |
| Interquartile Range (IQR) | 10.7% | 3.2% |
| Standard Deviation (Sample) | 9.3% | 2.8% |
| Standard Deviation (Population) | 9.2% | 2.8% |
Similar Demographics by Family Households
Demographics Similar to Sri Lankans by Family Households
In terms of family households, the demographic groups most similar to Sri Lankans are Cuban (67.7%, a difference of 0.040%), Inupiat (67.8%, a difference of 0.090%), Immigrants from Pakistan (67.7%, a difference of 0.090%), Samoan (67.9%, a difference of 0.33%), and Immigrants from South Eastern Asia (67.5%, a difference of 0.37%).
| Demographics | Rating | Rank | Family Households |
| Assyrians/Chaldeans/Syriacs | 100.0 /100 | #15 | Exceptional 68.2% |
| Immigrants | Vietnam | 100.0 /100 | #16 | Exceptional 68.2% |
| Chinese | 100.0 /100 | #17 | Exceptional 68.1% |
| Immigrants | Taiwan | 100.0 /100 | #18 | Exceptional 68.0% |
| Samoans | 100.0 /100 | #19 | Exceptional 67.9% |
| Inupiat | 100.0 /100 | #20 | Exceptional 67.8% |
| Cubans | 100.0 /100 | #21 | Exceptional 67.7% |
| Sri Lankans | 100.0 /100 | #22 | Exceptional 67.7% |
| Immigrants | Pakistan | 100.0 /100 | #23 | Exceptional 67.7% |
| Immigrants | South Eastern Asia | 100.0 /100 | #24 | Exceptional 67.5% |
| Immigrants | Nicaragua | 100.0 /100 | #25 | Exceptional 67.5% |
| Immigrants | India | 100.0 /100 | #26 | Exceptional 67.4% |
| Hispanics or Latinos | 100.0 /100 | #27 | Exceptional 67.4% |
| Hawaiians | 100.0 /100 | #28 | Exceptional 67.4% |
| Nicaraguans | 100.0 /100 | #29 | Exceptional 67.4% |
Demographics Similar to Whites/Caucasians by Family Households
In terms of family households, the demographic groups most similar to Whites/Caucasians are Alaska Native (65.1%, a difference of 0.0%), English (65.1%, a difference of 0.010%), Palestinian (65.1%, a difference of 0.010%), Immigrants from Guatemala (65.0%, a difference of 0.050%), and Scandinavian (65.0%, a difference of 0.060%).
| Demographics | Rating | Rank | Family Households |
| Central American Indians | 98.3 /100 | #99 | Exceptional 65.2% |
| Haitians | 98.1 /100 | #100 | Exceptional 65.2% |
| Chileans | 98.1 /100 | #101 | Exceptional 65.2% |
| Immigrants | Sri Lanka | 98.0 /100 | #102 | Exceptional 65.1% |
| Indians (Asian) | 97.9 /100 | #103 | Exceptional 65.1% |
| Spaniards | 97.8 /100 | #104 | Exceptional 65.1% |
| English | 97.4 /100 | #105 | Exceptional 65.1% |
| Whites/Caucasians | 97.3 /100 | #106 | Exceptional 65.1% |
| Alaska Natives | 97.3 /100 | #107 | Exceptional 65.1% |
| Palestinians | 97.2 /100 | #108 | Exceptional 65.1% |
| Immigrants | Guatemala | 96.9 /100 | #109 | Exceptional 65.0% |
| Scandinavians | 96.8 /100 | #110 | Exceptional 65.0% |
| Europeans | 96.8 /100 | #111 | Exceptional 65.0% |
| Immigrants | Jordan | 96.5 /100 | #112 | Exceptional 65.0% |
| Spanish | 96.2 /100 | #113 | Exceptional 65.0% |