Sri Lankan vs Pennsylvania German Births to Unmarried Women
COMPARE
Sri Lankan
Pennsylvania German
Births to Unmarried Women
Births to Unmarried Women Comparison
Sri Lankans
Pennsylvania Germans
28.9%
BIRTHS TO UNMARRIED WOMEN
97.5/ 100
METRIC RATING
85th/ 347
METRIC RANK
34.0%
BIRTHS TO UNMARRIED WOMEN
4.3/ 100
METRIC RATING
223rd/ 347
METRIC RANK
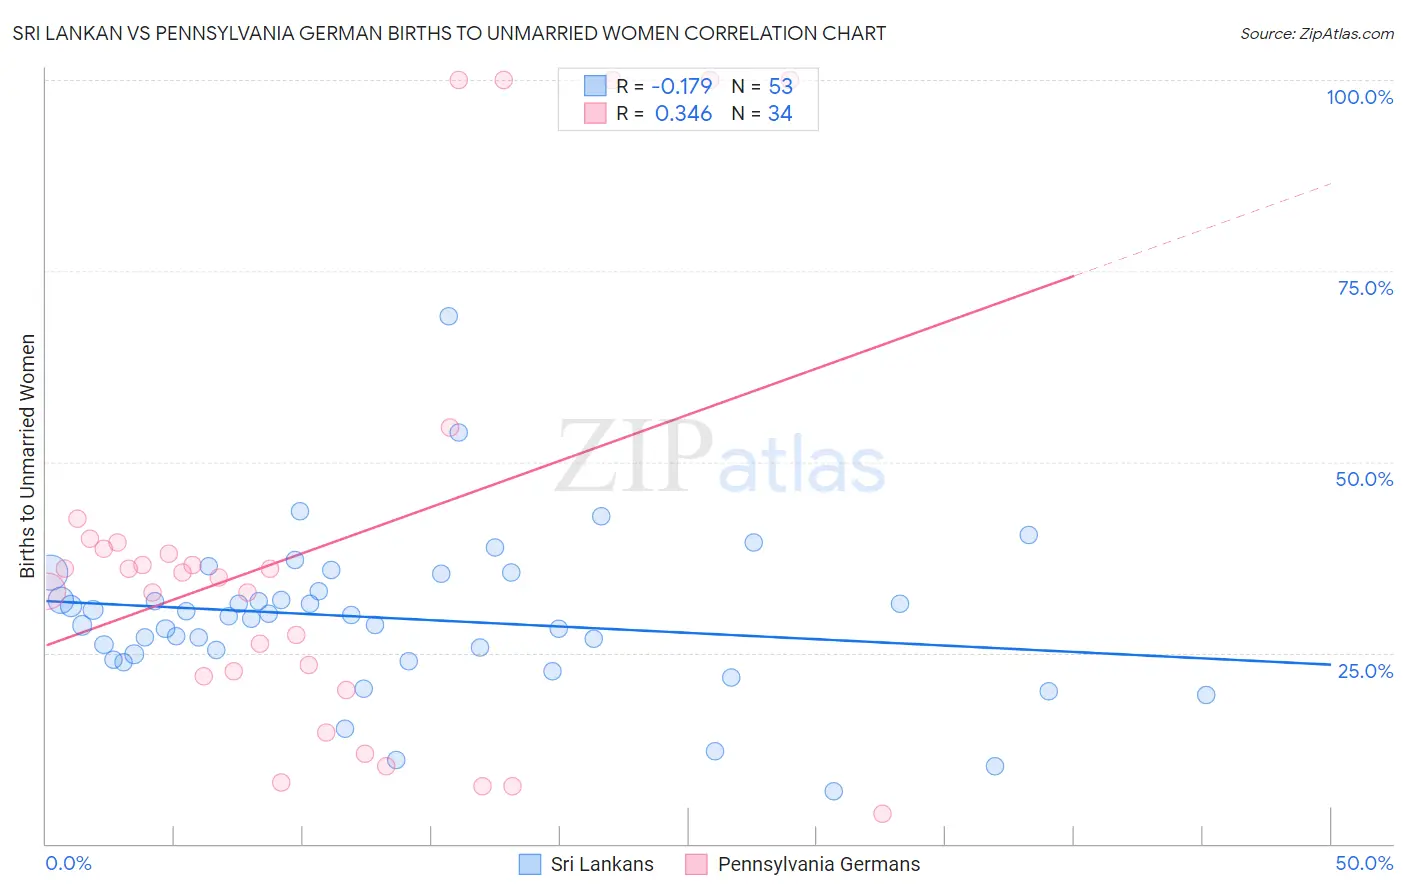
Sri Lankan vs Pennsylvania German Births to Unmarried Women Correlation Chart
The statistical analysis conducted on geographies consisting of 411,137,985 people shows a poor negative correlation between the proportion of Sri Lankans and percentage of births to unmarried women in the United States with a correlation coefficient (R) of -0.179 and weighted average of 28.9%. Similarly, the statistical analysis conducted on geographies consisting of 220,469,063 people shows a mild positive correlation between the proportion of Pennsylvania Germans and percentage of births to unmarried women in the United States with a correlation coefficient (R) of 0.346 and weighted average of 34.0%, a difference of 17.5%.
Births to Unmarried Women Correlation Summary
| Measurement | Sri Lankan | Pennsylvania German |
| Minimum | 6.9% | 4.0% |
| Maximum | 69.0% | 100.0% |
| Range | 62.1% | 96.0% |
| Mean | 29.5% | 38.5% |
| Median | 29.7% | 35.2% |
| Interquartile 25% (IQ1) | 24.4% | 21.9% |
| Interquartile 75% (IQ3) | 34.2% | 39.5% |
| Interquartile Range (IQR) | 9.8% | 17.6% |
| Standard Deviation (Sample) | 10.2% | 28.5% |
| Standard Deviation (Population) | 10.1% | 28.1% |
Similar Demographics by Births to Unmarried Women
Demographics Similar to Sri Lankans by Births to Unmarried Women
In terms of births to unmarried women, the demographic groups most similar to Sri Lankans are Immigrants from Jordan (29.0%, a difference of 0.070%), Taiwanese (29.0%, a difference of 0.15%), Immigrants from France (29.0%, a difference of 0.16%), Immigrants from Poland (28.9%, a difference of 0.17%), and Immigrants from Saudi Arabia (29.1%, a difference of 0.43%).
| Demographics | Rating | Rank | Births to Unmarried Women |
| Zimbabweans | 98.2 /100 | #78 | Exceptional 28.7% |
| Danes | 98.2 /100 | #79 | Exceptional 28.7% |
| Immigrants | Afghanistan | 98.1 /100 | #80 | Exceptional 28.7% |
| Immigrants | Austria | 98.1 /100 | #81 | Exceptional 28.7% |
| Romanians | 98.0 /100 | #82 | Exceptional 28.7% |
| Immigrants | Kuwait | 98.0 /100 | #83 | Exceptional 28.8% |
| Immigrants | Poland | 97.6 /100 | #84 | Exceptional 28.9% |
| Sri Lankans | 97.5 /100 | #85 | Exceptional 28.9% |
| Immigrants | Jordan | 97.4 /100 | #86 | Exceptional 29.0% |
| Taiwanese | 97.3 /100 | #87 | Exceptional 29.0% |
| Immigrants | France | 97.3 /100 | #88 | Exceptional 29.0% |
| Immigrants | Saudi Arabia | 97.0 /100 | #89 | Exceptional 29.1% |
| Immigrants | Latvia | 96.8 /100 | #90 | Exceptional 29.1% |
| Immigrants | Fiji | 96.6 /100 | #91 | Exceptional 29.2% |
| Arabs | 96.5 /100 | #92 | Exceptional 29.2% |
Demographics Similar to Pennsylvania Germans by Births to Unmarried Women
In terms of births to unmarried women, the demographic groups most similar to Pennsylvania Germans are Immigrants from Laos (34.0%, a difference of 0.0%), Spanish (34.1%, a difference of 0.17%), Immigrants from Uruguay (33.9%, a difference of 0.29%), Malaysian (33.9%, a difference of 0.35%), and Portuguese (33.8%, a difference of 0.53%).
| Demographics | Rating | Rank | Births to Unmarried Women |
| Nepalese | 7.8 /100 | #216 | Tragic 33.5% |
| Spaniards | 7.0 /100 | #217 | Tragic 33.6% |
| Immigrants | Ecuador | 5.9 /100 | #218 | Tragic 33.7% |
| Alsatians | 5.4 /100 | #219 | Tragic 33.8% |
| Portuguese | 5.4 /100 | #220 | Tragic 33.8% |
| Malaysians | 5.0 /100 | #221 | Tragic 33.9% |
| Immigrants | Uruguay | 4.8 /100 | #222 | Tragic 33.9% |
| Pennsylvania Germans | 4.3 /100 | #223 | Tragic 34.0% |
| Immigrants | Laos | 4.3 /100 | #224 | Tragic 34.0% |
| Spanish | 4.0 /100 | #225 | Tragic 34.1% |
| Delaware | 3.3 /100 | #226 | Tragic 34.2% |
| Immigrants | Panama | 3.3 /100 | #227 | Tragic 34.2% |
| Panamanians | 3.3 /100 | #228 | Tragic 34.2% |
| Immigrants | Sierra Leone | 3.1 /100 | #229 | Tragic 34.2% |
| Ghanaians | 3.1 /100 | #230 | Tragic 34.3% |