Scandinavian vs Cape Verdean Average Family Size
COMPARE
Scandinavian
Cape Verdean
Average Family Size
Average Family Size Comparison
Scandinavians
Cape Verdeans
3.14
AVERAGE FAMILY SIZE
0.2/ 100
METRIC RATING
293rd/ 347
METRIC RANK
3.17
AVERAGE FAMILY SIZE
1.6/ 100
METRIC RATING
255th/ 347
METRIC RANK
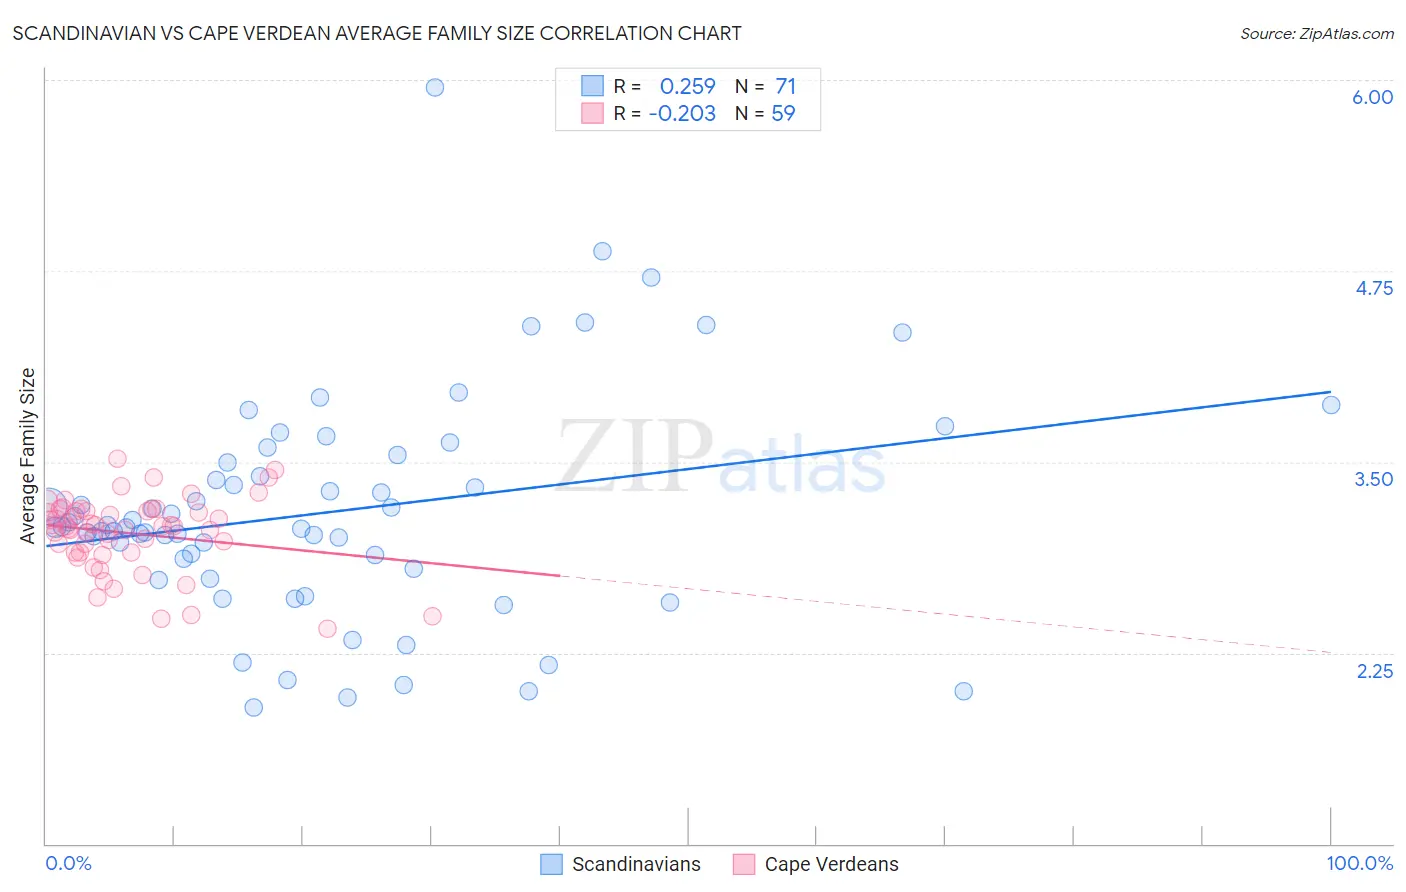
Scandinavian vs Cape Verdean Average Family Size Correlation Chart
The statistical analysis conducted on geographies consisting of 472,285,775 people shows a weak positive correlation between the proportion of Scandinavians and average family size in the United States with a correlation coefficient (R) of 0.259 and weighted average of 3.14. Similarly, the statistical analysis conducted on geographies consisting of 107,550,345 people shows a weak negative correlation between the proportion of Cape Verdeans and average family size in the United States with a correlation coefficient (R) of -0.203 and weighted average of 3.17, a difference of 0.92%.
Average Family Size Correlation Summary
| Measurement | Scandinavian | Cape Verdean |
| Minimum | 1.89 | 2.41 |
| Maximum | 5.95 | 3.52 |
| Range | 4.06 | 1.11 |
| Mean | 3.17 | 3.03 |
| Median | 3.07 | 3.08 |
| Interquartile 25% (IQ1) | 2.80 | 2.91 |
| Interquartile 75% (IQ3) | 3.49 | 3.18 |
| Interquartile Range (IQR) | 0.69 | 0.27 |
| Standard Deviation (Sample) | 0.73 | 0.24 |
| Standard Deviation (Population) | 0.72 | 0.24 |
Similar Demographics by Average Family Size
Demographics Similar to Scandinavians by Average Family Size
In terms of average family size, the demographic groups most similar to Scandinavians are European (3.14, a difference of 0.010%), Immigrants from Croatia (3.14, a difference of 0.020%), Alsatian (3.14, a difference of 0.030%), Austrian (3.14, a difference of 0.030%), and Ukrainian (3.14, a difference of 0.030%).
| Demographics | Rating | Rank | Average Family Size |
| Immigrants | Netherlands | 0.3 /100 | #286 | Tragic 3.14 |
| Greeks | 0.3 /100 | #287 | Tragic 3.14 |
| Immigrants | Czechoslovakia | 0.3 /100 | #288 | Tragic 3.14 |
| Immigrants | Norway | 0.3 /100 | #289 | Tragic 3.14 |
| Cypriots | 0.3 /100 | #290 | Tragic 3.14 |
| Alsatians | 0.2 /100 | #291 | Tragic 3.14 |
| Europeans | 0.2 /100 | #292 | Tragic 3.14 |
| Scandinavians | 0.2 /100 | #293 | Tragic 3.14 |
| Immigrants | Croatia | 0.2 /100 | #294 | Tragic 3.14 |
| Austrians | 0.2 /100 | #295 | Tragic 3.14 |
| Ukrainians | 0.2 /100 | #296 | Tragic 3.14 |
| Immigrants | Western Europe | 0.2 /100 | #297 | Tragic 3.14 |
| Colville | 0.2 /100 | #298 | Tragic 3.14 |
| Canadians | 0.2 /100 | #299 | Tragic 3.14 |
| Immigrants | Sweden | 0.2 /100 | #300 | Tragic 3.14 |
Demographics Similar to Cape Verdeans by Average Family Size
In terms of average family size, the demographic groups most similar to Cape Verdeans are Immigrants from Hungary (3.17, a difference of 0.010%), Immigrants from Saudi Arabia (3.17, a difference of 0.020%), South African (3.17, a difference of 0.020%), Immigrants from Kazakhstan (3.17, a difference of 0.030%), and Immigrants from Spain (3.17, a difference of 0.050%).
| Demographics | Rating | Rank | Average Family Size |
| Immigrants | Belarus | 2.3 /100 | #248 | Tragic 3.17 |
| Immigrants | Eastern Europe | 2.1 /100 | #249 | Tragic 3.17 |
| Puget Sound Salish | 1.9 /100 | #250 | Tragic 3.17 |
| Immigrants | Spain | 1.8 /100 | #251 | Tragic 3.17 |
| Immigrants | Saudi Arabia | 1.7 /100 | #252 | Tragic 3.17 |
| South Africans | 1.7 /100 | #253 | Tragic 3.17 |
| Immigrants | Hungary | 1.7 /100 | #254 | Tragic 3.17 |
| Cape Verdeans | 1.6 /100 | #255 | Tragic 3.17 |
| Immigrants | Kazakhstan | 1.5 /100 | #256 | Tragic 3.17 |
| Albanians | 1.5 /100 | #257 | Tragic 3.17 |
| Turks | 1.3 /100 | #258 | Tragic 3.16 |
| Potawatomi | 1.3 /100 | #259 | Tragic 3.16 |
| Immigrants | Albania | 1.3 /100 | #260 | Tragic 3.16 |
| Immigrants | North Macedonia | 1.3 /100 | #261 | Tragic 3.16 |
| Immigrants | Russia | 1.3 /100 | #262 | Tragic 3.16 |