Scandinavian vs Russian Professional Degree
COMPARE
Scandinavian
Russian
Professional Degree
Professional Degree Comparison
Scandinavians
Russians
4.2%
PROFESSIONAL DEGREE
25.8/ 100
METRIC RATING
194th/ 347
METRIC RANK
6.3%
PROFESSIONAL DEGREE
100.0/ 100
METRIC RATING
23rd/ 347
METRIC RANK
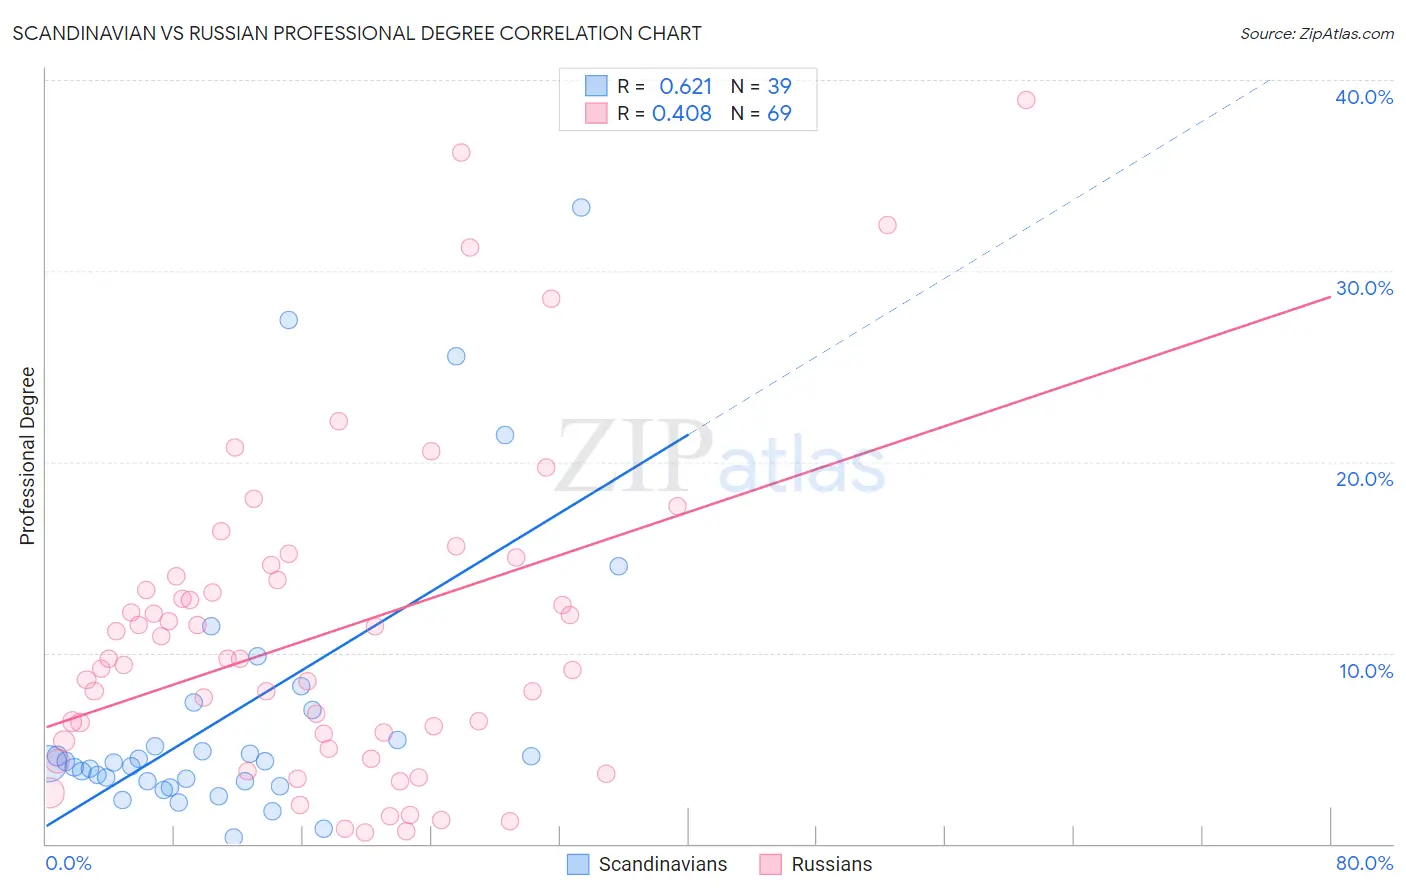
Scandinavian vs Russian Professional Degree Correlation Chart
The statistical analysis conducted on geographies consisting of 469,840,840 people shows a significant positive correlation between the proportion of Scandinavians and percentage of population with at least professional degree education in the United States with a correlation coefficient (R) of 0.621 and weighted average of 4.2%. Similarly, the statistical analysis conducted on geographies consisting of 509,341,332 people shows a moderate positive correlation between the proportion of Russians and percentage of population with at least professional degree education in the United States with a correlation coefficient (R) of 0.408 and weighted average of 6.3%, a difference of 49.4%.
Professional Degree Correlation Summary
| Measurement | Scandinavian | Russian |
| Minimum | 0.33% | 0.56% |
| Maximum | 33.3% | 39.0% |
| Range | 33.0% | 38.4% |
| Mean | 6.9% | 11.0% |
| Median | 4.2% | 9.7% |
| Interquartile 25% (IQ1) | 3.3% | 5.2% |
| Interquartile 75% (IQ3) | 7.0% | 13.9% |
| Interquartile Range (IQR) | 3.8% | 8.7% |
| Standard Deviation (Sample) | 7.5% | 8.3% |
| Standard Deviation (Population) | 7.4% | 8.3% |
Similar Demographics by Professional Degree
Demographics Similar to Scandinavians by Professional Degree
In terms of professional degree, the demographic groups most similar to Scandinavians are Nigerian (4.2%, a difference of 0.24%), French (4.2%, a difference of 0.25%), Ghanaian (4.3%, a difference of 0.29%), Spanish (4.2%, a difference of 0.57%), and Sri Lankan (4.3%, a difference of 0.62%).
| Demographics | Rating | Rank | Professional Degree |
| Immigrants | Cameroon | 33.3 /100 | #187 | Fair 4.3% |
| Immigrants | Thailand | 31.7 /100 | #188 | Fair 4.3% |
| Slovaks | 30.7 /100 | #189 | Fair 4.3% |
| Immigrants | Poland | 29.2 /100 | #190 | Fair 4.3% |
| Sri Lankans | 29.0 /100 | #191 | Fair 4.3% |
| Ghanaians | 27.3 /100 | #192 | Fair 4.3% |
| French | 27.1 /100 | #193 | Fair 4.2% |
| Scandinavians | 25.8 /100 | #194 | Fair 4.2% |
| Nigerians | 24.6 /100 | #195 | Fair 4.2% |
| Spanish | 23.0 /100 | #196 | Fair 4.2% |
| Czechoslovakians | 22.4 /100 | #197 | Fair 4.2% |
| Immigrants | Middle Africa | 22.1 /100 | #198 | Fair 4.2% |
| Norwegians | 20.5 /100 | #199 | Fair 4.2% |
| Immigrants | North Macedonia | 20.2 /100 | #200 | Fair 4.2% |
| Finns | 18.7 /100 | #201 | Poor 4.2% |
Demographics Similar to Russians by Professional Degree
In terms of professional degree, the demographic groups most similar to Russians are Immigrants from Spain (6.3%, a difference of 0.040%), Immigrants from Japan (6.4%, a difference of 0.48%), Immigrants from Ireland (6.3%, a difference of 0.53%), Immigrants from Hong Kong (6.4%, a difference of 1.2%), and Latvian (6.2%, a difference of 1.4%).
| Demographics | Rating | Rank | Professional Degree |
| Immigrants | Sweden | 100.0 /100 | #16 | Exceptional 6.7% |
| Immigrants | Eastern Asia | 100.0 /100 | #17 | Exceptional 6.6% |
| Soviet Union | 100.0 /100 | #18 | Exceptional 6.6% |
| Indians (Asian) | 100.0 /100 | #19 | Exceptional 6.5% |
| Immigrants | Denmark | 100.0 /100 | #20 | Exceptional 6.4% |
| Immigrants | Hong Kong | 100.0 /100 | #21 | Exceptional 6.4% |
| Immigrants | Japan | 100.0 /100 | #22 | Exceptional 6.4% |
| Russians | 100.0 /100 | #23 | Exceptional 6.3% |
| Immigrants | Spain | 100.0 /100 | #24 | Exceptional 6.3% |
| Immigrants | Ireland | 100.0 /100 | #25 | Exceptional 6.3% |
| Latvians | 100.0 /100 | #26 | Exceptional 6.2% |
| Immigrants | Northern Europe | 100.0 /100 | #27 | Exceptional 6.2% |
| Turks | 100.0 /100 | #28 | Exceptional 6.2% |
| Immigrants | Sri Lanka | 100.0 /100 | #29 | Exceptional 6.2% |
| Immigrants | Turkey | 100.0 /100 | #30 | Exceptional 6.2% |