Scandinavian vs Hmong Average Family Size
COMPARE
Scandinavian
Hmong
Average Family Size
Average Family Size Comparison
Scandinavians
Hmong
3.14
AVERAGE FAMILY SIZE
0.2/ 100
METRIC RATING
293rd/ 347
METRIC RANK
3.21
AVERAGE FAMILY SIZE
20.7/ 100
METRIC RATING
199th/ 347
METRIC RANK
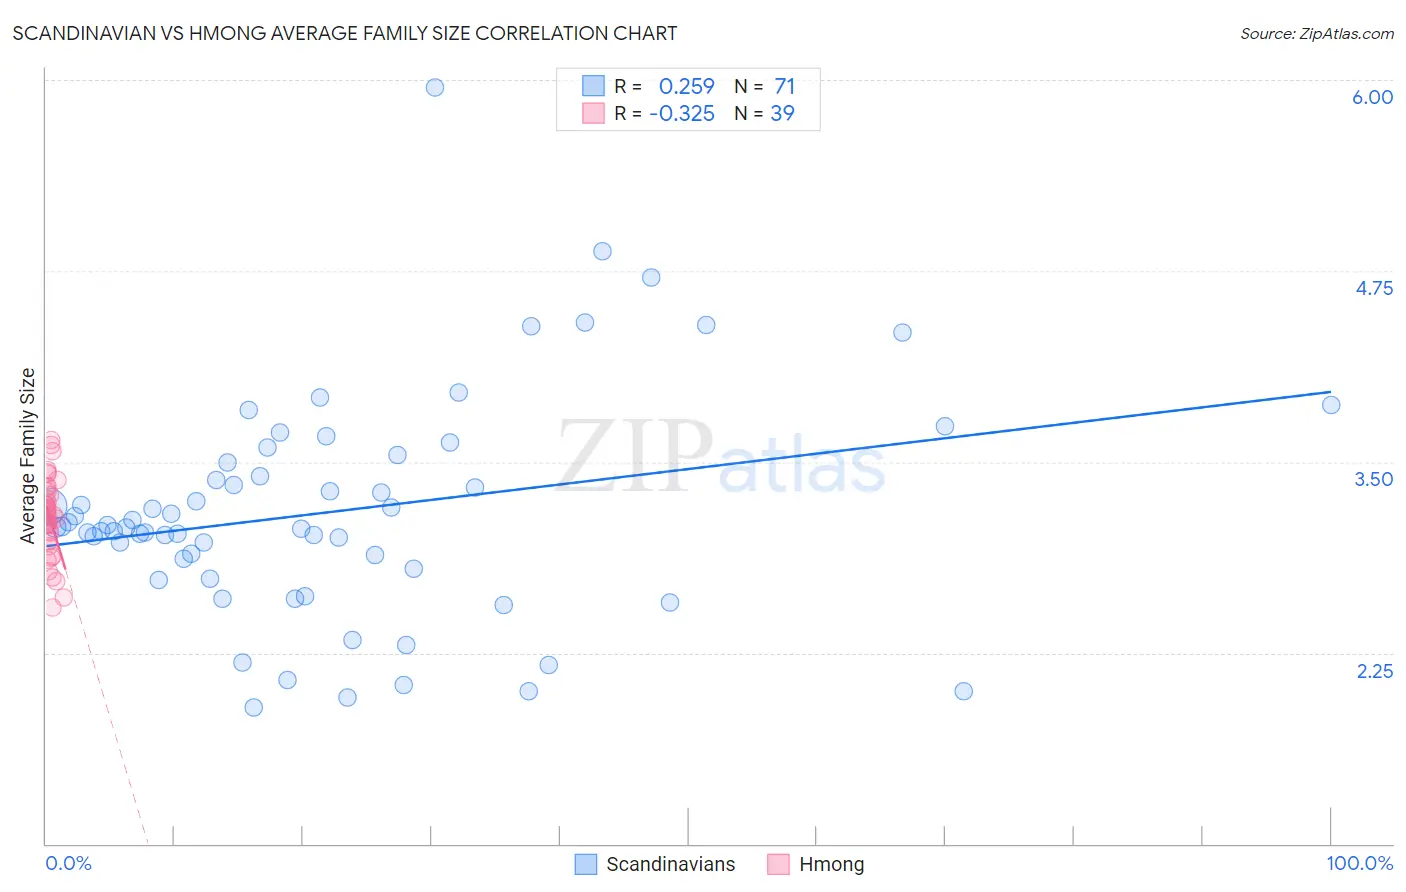
Scandinavian vs Hmong Average Family Size Correlation Chart
The statistical analysis conducted on geographies consisting of 472,285,775 people shows a weak positive correlation between the proportion of Scandinavians and average family size in the United States with a correlation coefficient (R) of 0.259 and weighted average of 3.14. Similarly, the statistical analysis conducted on geographies consisting of 24,678,157 people shows a mild negative correlation between the proportion of Hmong and average family size in the United States with a correlation coefficient (R) of -0.325 and weighted average of 3.21, a difference of 2.2%.
Average Family Size Correlation Summary
| Measurement | Scandinavian | Hmong |
| Minimum | 1.89 | 2.55 |
| Maximum | 5.95 | 3.64 |
| Range | 4.06 | 1.09 |
| Mean | 3.17 | 3.14 |
| Median | 3.07 | 3.15 |
| Interquartile 25% (IQ1) | 2.80 | 2.98 |
| Interquartile 75% (IQ3) | 3.49 | 3.31 |
| Interquartile Range (IQR) | 0.69 | 0.33 |
| Standard Deviation (Sample) | 0.73 | 0.26 |
| Standard Deviation (Population) | 0.72 | 0.26 |
Similar Demographics by Average Family Size
Demographics Similar to Scandinavians by Average Family Size
In terms of average family size, the demographic groups most similar to Scandinavians are European (3.14, a difference of 0.010%), Immigrants from Croatia (3.14, a difference of 0.020%), Alsatian (3.14, a difference of 0.030%), Austrian (3.14, a difference of 0.030%), and Ukrainian (3.14, a difference of 0.030%).
| Demographics | Rating | Rank | Average Family Size |
| Immigrants | Netherlands | 0.3 /100 | #286 | Tragic 3.14 |
| Greeks | 0.3 /100 | #287 | Tragic 3.14 |
| Immigrants | Czechoslovakia | 0.3 /100 | #288 | Tragic 3.14 |
| Immigrants | Norway | 0.3 /100 | #289 | Tragic 3.14 |
| Cypriots | 0.3 /100 | #290 | Tragic 3.14 |
| Alsatians | 0.2 /100 | #291 | Tragic 3.14 |
| Europeans | 0.2 /100 | #292 | Tragic 3.14 |
| Scandinavians | 0.2 /100 | #293 | Tragic 3.14 |
| Immigrants | Croatia | 0.2 /100 | #294 | Tragic 3.14 |
| Austrians | 0.2 /100 | #295 | Tragic 3.14 |
| Ukrainians | 0.2 /100 | #296 | Tragic 3.14 |
| Immigrants | Western Europe | 0.2 /100 | #297 | Tragic 3.14 |
| Colville | 0.2 /100 | #298 | Tragic 3.14 |
| Canadians | 0.2 /100 | #299 | Tragic 3.14 |
| Immigrants | Sweden | 0.2 /100 | #300 | Tragic 3.14 |
Demographics Similar to Hmong by Average Family Size
In terms of average family size, the demographic groups most similar to Hmong are Immigrants from the Azores (3.21, a difference of 0.020%), Immigrants from Kenya (3.21, a difference of 0.040%), Immigrants from Morocco (3.21, a difference of 0.060%), Immigrants from India (3.21, a difference of 0.070%), and Immigrants from Nepal (3.21, a difference of 0.080%).
| Demographics | Rating | Rank | Average Family Size |
| Immigrants | Eastern Africa | 30.1 /100 | #192 | Fair 3.22 |
| Immigrants | Israel | 29.3 /100 | #193 | Fair 3.22 |
| Immigrants | Sudan | 29.1 /100 | #194 | Fair 3.22 |
| Choctaw | 28.3 /100 | #195 | Fair 3.21 |
| Senegalese | 28.2 /100 | #196 | Fair 3.21 |
| Kenyans | 28.0 /100 | #197 | Fair 3.21 |
| Immigrants | Azores | 21.7 /100 | #198 | Fair 3.21 |
| Hmong | 20.7 /100 | #199 | Fair 3.21 |
| Immigrants | Kenya | 19.2 /100 | #200 | Poor 3.21 |
| Immigrants | Morocco | 18.5 /100 | #201 | Poor 3.21 |
| Immigrants | India | 18.5 /100 | #202 | Poor 3.21 |
| Immigrants | Nepal | 18.1 /100 | #203 | Poor 3.21 |
| Immigrants | Poland | 16.6 /100 | #204 | Poor 3.20 |
| Paraguayans | 16.3 /100 | #205 | Poor 3.20 |
| Immigrants | Cabo Verde | 16.0 /100 | #206 | Poor 3.20 |