Scandinavian vs Immigrants from Mexico Average Family Size
COMPARE
Scandinavian
Immigrants from Mexico
Average Family Size
Average Family Size Comparison
Scandinavians
Immigrants from Mexico
3.14
AVERAGE FAMILY SIZE
0.2/ 100
METRIC RATING
293rd/ 347
METRIC RANK
3.52
AVERAGE FAMILY SIZE
100.0/ 100
METRIC RATING
12th/ 347
METRIC RANK
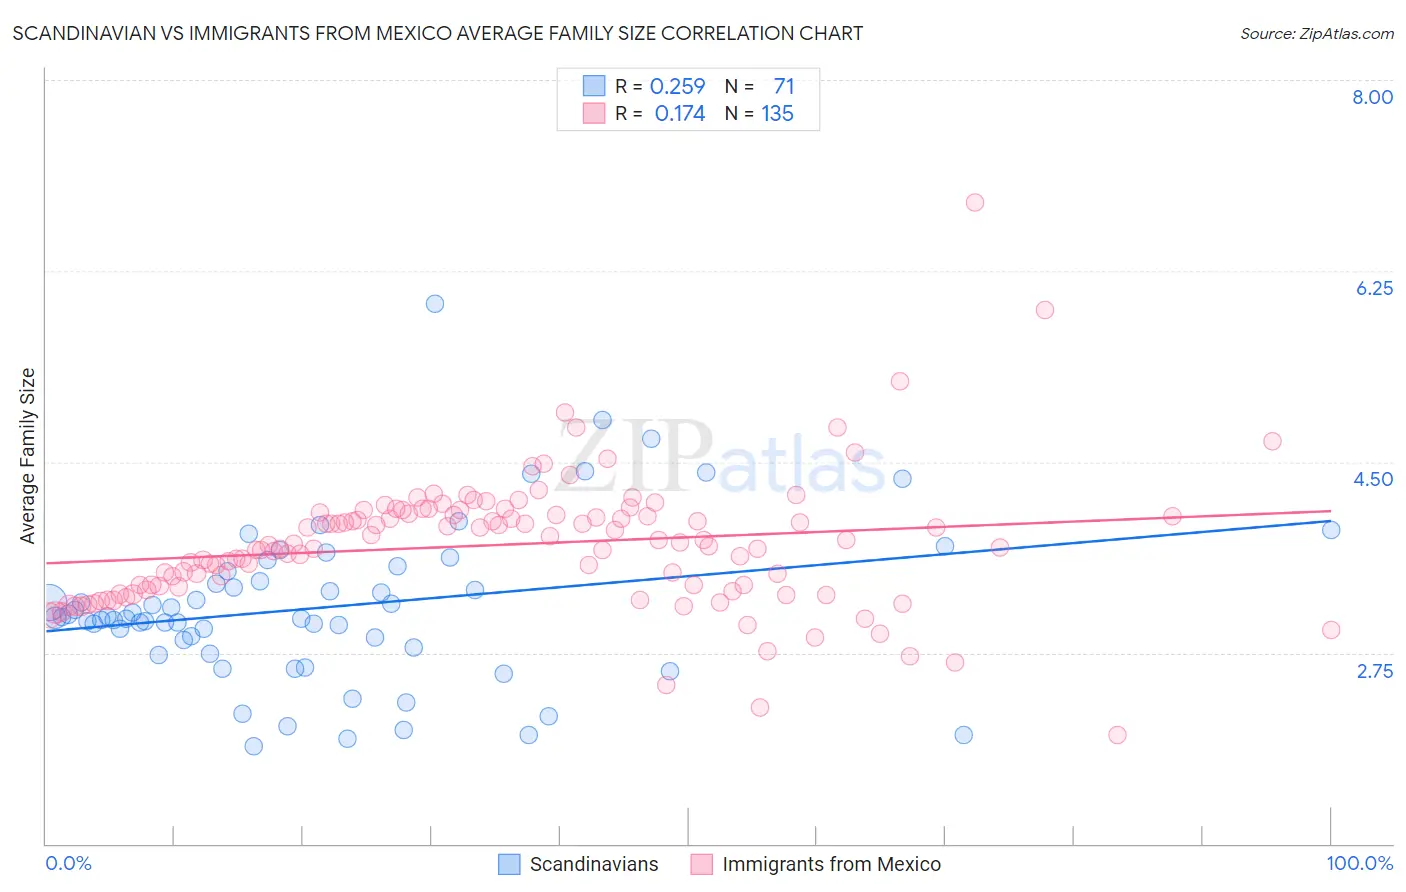
Scandinavian vs Immigrants from Mexico Average Family Size Correlation Chart
The statistical analysis conducted on geographies consisting of 472,285,775 people shows a weak positive correlation between the proportion of Scandinavians and average family size in the United States with a correlation coefficient (R) of 0.259 and weighted average of 3.14. Similarly, the statistical analysis conducted on geographies consisting of 513,403,762 people shows a poor positive correlation between the proportion of Immigrants from Mexico and average family size in the United States with a correlation coefficient (R) of 0.174 and weighted average of 3.52, a difference of 12.1%.
Average Family Size Correlation Summary
| Measurement | Scandinavian | Immigrants from Mexico |
| Minimum | 1.89 | 2.00 |
| Maximum | 5.95 | 6.88 |
| Range | 4.06 | 4.88 |
| Mean | 3.17 | 3.74 |
| Median | 3.07 | 3.73 |
| Interquartile 25% (IQ1) | 2.80 | 3.35 |
| Interquartile 75% (IQ3) | 3.49 | 4.02 |
| Interquartile Range (IQR) | 0.69 | 0.66 |
| Standard Deviation (Sample) | 0.73 | 0.61 |
| Standard Deviation (Population) | 0.72 | 0.60 |
Similar Demographics by Average Family Size
Demographics Similar to Scandinavians by Average Family Size
In terms of average family size, the demographic groups most similar to Scandinavians are European (3.14, a difference of 0.010%), Immigrants from Croatia (3.14, a difference of 0.020%), Alsatian (3.14, a difference of 0.030%), Austrian (3.14, a difference of 0.030%), and Ukrainian (3.14, a difference of 0.030%).
| Demographics | Rating | Rank | Average Family Size |
| Immigrants | Netherlands | 0.3 /100 | #286 | Tragic 3.14 |
| Greeks | 0.3 /100 | #287 | Tragic 3.14 |
| Immigrants | Czechoslovakia | 0.3 /100 | #288 | Tragic 3.14 |
| Immigrants | Norway | 0.3 /100 | #289 | Tragic 3.14 |
| Cypriots | 0.3 /100 | #290 | Tragic 3.14 |
| Alsatians | 0.2 /100 | #291 | Tragic 3.14 |
| Europeans | 0.2 /100 | #292 | Tragic 3.14 |
| Scandinavians | 0.2 /100 | #293 | Tragic 3.14 |
| Immigrants | Croatia | 0.2 /100 | #294 | Tragic 3.14 |
| Austrians | 0.2 /100 | #295 | Tragic 3.14 |
| Ukrainians | 0.2 /100 | #296 | Tragic 3.14 |
| Immigrants | Western Europe | 0.2 /100 | #297 | Tragic 3.14 |
| Colville | 0.2 /100 | #298 | Tragic 3.14 |
| Canadians | 0.2 /100 | #299 | Tragic 3.14 |
| Immigrants | Sweden | 0.2 /100 | #300 | Tragic 3.14 |
Demographics Similar to Immigrants from Mexico by Average Family Size
In terms of average family size, the demographic groups most similar to Immigrants from Mexico are Sioux (3.52, a difference of 0.080%), Tohono O'odham (3.53, a difference of 0.42%), Immigrants from Central America (3.49, a difference of 0.71%), Tongan (3.49, a difference of 0.76%), and Ute (3.49, a difference of 0.82%).
| Demographics | Rating | Rank | Average Family Size |
| Navajo | 100.0 /100 | #5 | Exceptional 3.65 |
| Arapaho | 100.0 /100 | #6 | Exceptional 3.64 |
| Inupiat | 100.0 /100 | #7 | Exceptional 3.63 |
| Immigrants | Yemen | 100.0 /100 | #8 | Exceptional 3.60 |
| Hopi | 100.0 /100 | #9 | Exceptional 3.60 |
| Spanish American Indians | 100.0 /100 | #10 | Exceptional 3.58 |
| Tohono O'odham | 100.0 /100 | #11 | Exceptional 3.53 |
| Immigrants | Mexico | 100.0 /100 | #12 | Exceptional 3.52 |
| Sioux | 100.0 /100 | #13 | Exceptional 3.52 |
| Immigrants | Central America | 100.0 /100 | #14 | Exceptional 3.49 |
| Tongans | 100.0 /100 | #15 | Exceptional 3.49 |
| Ute | 100.0 /100 | #16 | Exceptional 3.49 |
| Immigrants | El Salvador | 100.0 /100 | #17 | Exceptional 3.49 |
| Salvadorans | 100.0 /100 | #18 | Exceptional 3.48 |
| Mexicans | 100.0 /100 | #19 | Exceptional 3.48 |