Scandinavian vs Afghan Average Family Size

COMPARE

Scandinavian
Race
Ancestry
AfricanAlaska NativeAlaskan AthabascanAlbanianAleutAlsatianAmericanApacheArabArapahoArgentineanArmenianAssyrian/Chaldean/SyriacAustralianAustrianBahamianBangladeshiBarbadianBasqueBelgianBelizeanBermudanBhutaneseBlackfeetBolivianBrazilianBritishBritish West IndianBulgarianBurmeseCajunCambodianCanadianCape VerdeanCarpatho RusynCelticCentral AmericanCentral American IndianCherokeeCheyenneChickasawChileanChineseChippewaChoctawColombianColvilleComancheCosta RicanCreeCreekCroatianCrowCubanCypriotCzechCzechoslovakianDanishDelawareDominicanDutchDutch West IndianEastern EuropeanEcuadorianEgyptianEnglishEstonianEthiopianEuropeanFijianFilipinoFinnishFrenchFrench American IndianFrench CanadianGermanGerman RussianGhanaianGreekGuamanian/ChamorroGuatemalanGuyaneseHaitianHmongHonduranHopiHoumaHungarianIcelanderIndian (Asian)IndonesianInupiatIranianIraqiIrishIroquoisIsraeliItalianJamaicanJapaneseJordanianKenyanKiowaKoreanLaotianLatvianLebaneseLiberianLithuanianLumbeeLuxembourgerMacedonianMalaysianMalteseMarshalleseMenomineeMexicanMexican American IndianMongolianMoroccanNative HawaiianNavajoNepaleseNew ZealanderNicaraguanNigerianNorthern EuropeanNorwegianOkinawanOsageOttawaPaiutePakistaniPalestinianPanamanianParaguayanPennsylvania GermanPeruvianPimaPolishPortuguesePotawatomiPuebloPuerto RicanPuget Sound SalishRomanianRussianSalvadoranSamoanScandinavianScotch-IrishScottishSeminoleSenegaleseSerbianShoshoneSierra LeoneanSiouxSlavicSlovakSloveneSomaliSouth AfricanSouth AmericanSouth American IndianSoviet UnionSpaniardSpanishSpanish AmericanSpanish American IndianSri LankanSubsaharan AfricanSudaneseSwedishSwissSyrianTaiwaneseThaiTlingit-HaidaTohono O'OdhamTonganTrinidadian and TobagonianTsimshianTurkishU.S. Virgin IslanderUgandanUkrainianUruguayanUteVenezuelanVietnameseWelshWest IndianYakamaYaquiYugoslavianYumanYup'ikZimbabwean
Immigration
NonimmigrantsImmigrantsAfghanistanAfricaAlbaniaArgentinaArmeniaAsiaAustraliaAustriaBahamasBangladeshBarbadosBelarusBelgiumBelizeBoliviaBosnia and HerzegovinaBrazilBulgariaBurma/MyanmarCabo VerdeCambodiaCameroonCanadaCaribbeanCentral AmericaChileChinaColombiaCongoCosta RicaCroatiaCubaCzechoslovakiaDenmarkDominicaDominican RepublicEastern AfricaEastern AsiaEastern EuropeEcuadorEgyptEl SalvadorEnglandEritreaEthiopiaEuropeFijiFranceGermanyGhanaGreeceGrenadaGuatemalaGuyanaHaitiHondurasHong KongHungaryIndiaIndonesiaIranIraqIrelandIsraelItalyJamaicaJapanJordanKazakhstanKenyaKoreaKuwaitLaosLatin AmericaLatviaLebanonLiberiaLithuaniaMalaysiaMexicoMicronesiaMiddle AfricaMoldovaMoroccoNepalNetherlandsNicaraguaNigeriaNorth AmericaNorth MacedoniaNorthern AfricaNorthern EuropeNorwayOceaniaPakistanPanamaPeruPhilippinesPolandPortugalRomaniaRussiaSaudi ArabiaScotlandSenegalSerbiaSierra LeoneSingaporeSomaliaSouth AfricaSouth AmericaSouth Central AsiaSouth Eastern AsiaSouthern EuropeSpainSri LankaSt. Vincent and the GrenadinesSudanSwedenSwitzerlandSyriaTaiwanThailandTrinidad and TobagoTurkeyUgandaUkraineUruguayUzbekistanVenezuelaVietnamWest IndiesWestern AfricaWestern AsiaWestern EuropeYemenZaireZimbabweAzores
Afghan
Race
Ancestry
AfghanAfricanAlaska NativeAlaskan AthabascanAlbanianAleutAlsatianAmericanApacheArabArapahoArgentineanArmenianAssyrian/Chaldean/SyriacAustralianAustrianBahamianBangladeshiBarbadianBasqueBelgianBelizeanBermudanBhutaneseBlackfeetBolivianBrazilianBritishBritish West IndianBulgarianBurmeseCajunCambodianCanadianCape VerdeanCarpatho RusynCelticCentral AmericanCentral American IndianCherokeeCheyenneChickasawChileanChineseChippewaChoctawColombianColvilleComancheCosta RicanCreeCreekCroatianCrowCubanCypriotCzechCzechoslovakianDanishDelawareDominicanDutchDutch West IndianEastern EuropeanEcuadorianEgyptianEnglishEstonianEthiopianEuropeanFijianFilipinoFinnishFrenchFrench American IndianFrench CanadianGermanGerman RussianGhanaianGreekGuamanian/ChamorroGuatemalanGuyaneseHaitianHmongHonduranHopiHoumaHungarianIcelanderIndian (Asian)IndonesianInupiatIranianIraqiIrishIroquoisIsraeliItalianJamaicanJapaneseJordanianKenyanKiowaKoreanLaotianLatvianLebaneseLiberianLithuanianLumbeeLuxembourgerMacedonianMalaysianMalteseMarshalleseMenomineeMexicanMexican American IndianMongolianMoroccanNative HawaiianNavajoNepaleseNew ZealanderNicaraguanNigerianNorthern EuropeanNorwegianOkinawanOsageOttawaPaiutePakistaniPalestinianPanamanianParaguayanPennsylvania GermanPeruvianPimaPolishPortuguesePotawatomiPuebloPuerto RicanPuget Sound SalishRomanianRussianSalvadoranSamoanScotch-IrishScottishSeminoleSenegaleseSerbianShoshoneSierra LeoneanSiouxSlavicSlovakSloveneSomaliSouth AfricanSouth AmericanSouth American IndianSoviet UnionSpaniardSpanishSpanish AmericanSpanish American IndianSri LankanSubsaharan AfricanSudaneseSwedishSwissSyrianTaiwaneseThaiTlingit-HaidaTohono O'OdhamTonganTrinidadian and TobagonianTsimshianTurkishU.S. Virgin IslanderUgandanUkrainianUruguayanUteVenezuelanVietnameseWelshWest IndianYakamaYaquiYugoslavianYumanYup'ikZimbabwean
Immigration
NonimmigrantsImmigrantsAfghanistanAfricaAlbaniaArgentinaArmeniaAsiaAustraliaAustriaBahamasBangladeshBarbadosBelarusBelgiumBelizeBoliviaBosnia and HerzegovinaBrazilBulgariaBurma/MyanmarCabo VerdeCambodiaCameroonCanadaCaribbeanCentral AmericaChileChinaColombiaCongoCosta RicaCroatiaCubaCzechoslovakiaDenmarkDominicaDominican RepublicEastern AfricaEastern AsiaEastern EuropeEcuadorEgyptEl SalvadorEnglandEritreaEthiopiaEuropeFijiFranceGermanyGhanaGreeceGrenadaGuatemalaGuyanaHaitiHondurasHong KongHungaryIndiaIndonesiaIranIraqIrelandIsraelItalyJamaicaJapanJordanKazakhstanKenyaKoreaKuwaitLaosLatin AmericaLatviaLebanonLiberiaLithuaniaMalaysiaMexicoMicronesiaMiddle AfricaMoldovaMoroccoNepalNetherlandsNicaraguaNigeriaNorth AmericaNorth MacedoniaNorthern AfricaNorthern EuropeNorwayOceaniaPakistanPanamaPeruPhilippinesPolandPortugalRomaniaRussiaSaudi ArabiaScotlandSenegalSerbiaSierra LeoneSingaporeSomaliaSouth AfricaSouth AmericaSouth Central AsiaSouth Eastern AsiaSouthern EuropeSpainSri LankaSt. Vincent and the GrenadinesSudanSwedenSwitzerlandSyriaTaiwanThailandTrinidad and TobagoTurkeyUgandaUkraineUruguayUzbekistanVenezuelaVietnamWest IndiesWestern AfricaWestern AsiaWestern EuropeYemenZaireZimbabweAzores
Average Family Size
Income
Poverty
Unemployment
Labor Participation
Family Structure
Vehicle Availability
Education Level
Disability

Average Family Size Comparison

Scandinavians

Afghans

Tragic
Exceptional
3.14
AVERAGE FAMILY SIZE
0.2/ 100
METRIC RATING
293rd/ 347
METRIC RANK
3.31
AVERAGE FAMILY SIZE
99.7/ 100
METRIC RATING
85th/ 347
METRIC RANK

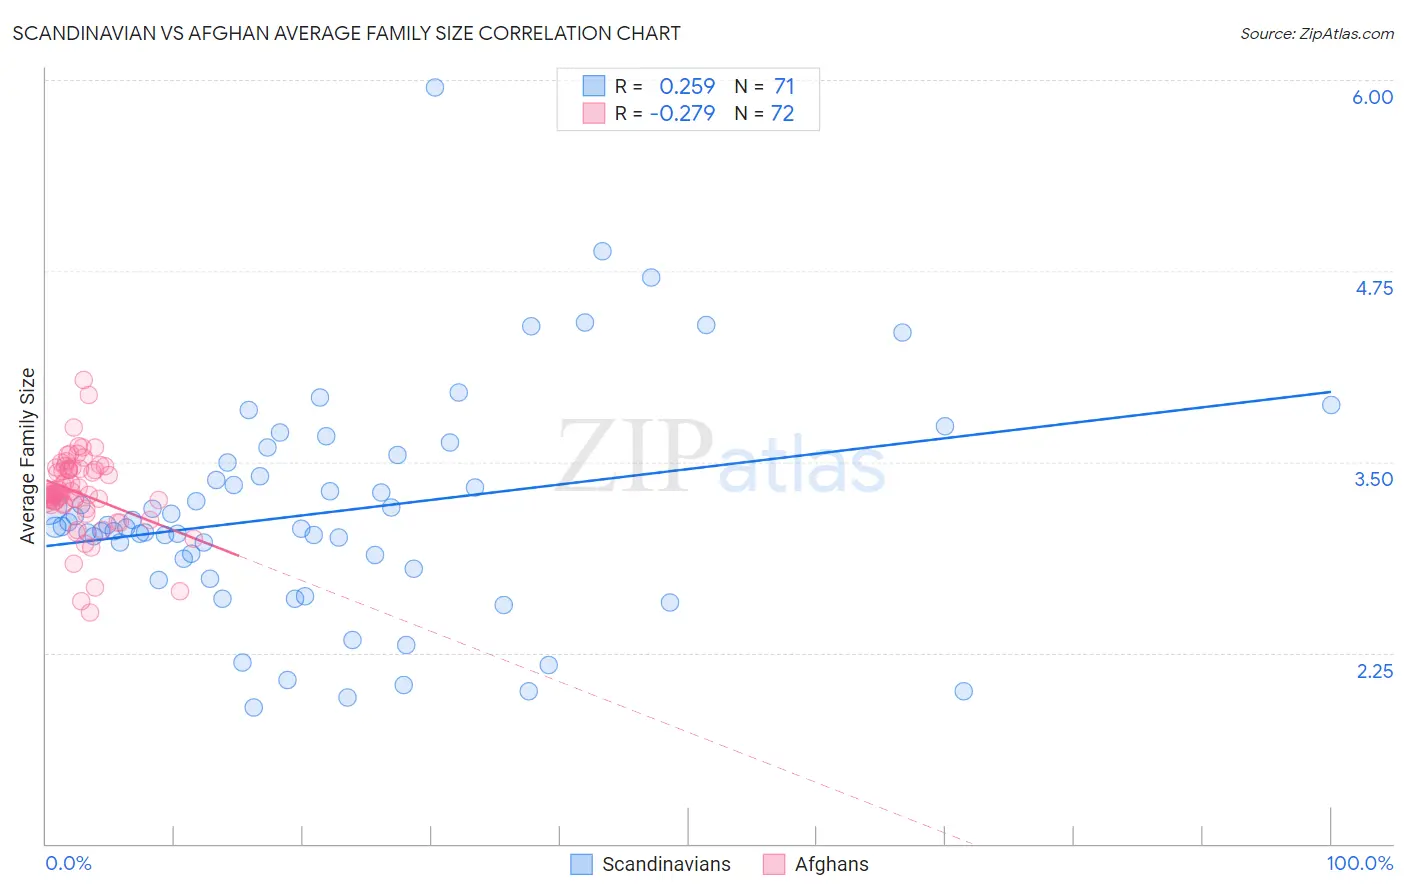
Scandinavian vs Afghan Average Family Size Correlation Chart

The statistical analysis conducted on geographies consisting of 472,285,775 people shows a weak positive correlation between the proportion of Scandinavians and average family size in the United States with a correlation coefficient (R) of 0.259 and weighted average of 3.14. Similarly, the statistical analysis conducted on geographies consisting of 148,832,546 people shows a weak negative correlation between the proportion of Afghans and average family size in the United States with a correlation coefficient (R) of -0.279 and weighted average of 3.31, a difference of 5.6%.
Scandinavian vs Afghan Average Family Size

Average Family Size Correlation Summary

MeasurementScandinavianAfghan
Minimum1.892.51
Maximum5.954.04
Range4.061.53
Mean3.173.30
Median3.073.29
Interquartile 25% (IQ1)2.803.22
Interquartile 75% (IQ3)3.493.46
Interquartile Range (IQR)0.690.23
Standard Deviation (Sample)0.730.26
Standard Deviation (Population)0.720.26

Similar Demographics by Average Family Size

Demographics Similar to Scandinavians by Average Family Size

In terms of average family size, the demographic groups most similar to Scandinavians are European (3.14, a difference of 0.010%), Immigrants from Croatia (3.14, a difference of 0.020%), Alsatian (3.14, a difference of 0.030%), Austrian (3.14, a difference of 0.030%), and Ukrainian (3.14, a difference of 0.030%).
DemographicsRating | RankAverage Family Size
Immigrants | Netherlands
0.3
/100
|
#286
Tragic
3.14
Greeks
0.3
/100
|
#287
Tragic
3.14
Immigrants | Czechoslovakia
0.3
/100
|
#288
Tragic
3.14
Immigrants | Norway
0.3
/100
|
#289
Tragic
3.14
Cypriots
0.3
/100
|
#290
Tragic
3.14
Alsatians
0.2
/100
|
#291
Tragic
3.14
Europeans
0.2
/100
|
#292
Tragic
3.14
Scandinavians
0.2
/100
|
#293
Tragic
3.14
Immigrants | Croatia
0.2
/100
|
#294
Tragic
3.14
Austrians
0.2
/100
|
#295
Tragic
3.14
Ukrainians
0.2
/100
|
#296
Tragic
3.14
Immigrants | Western Europe
0.2
/100
|
#297
Tragic
3.14
Colville
0.2
/100
|
#298
Tragic
3.14
Canadians
0.2
/100
|
#299
Tragic
3.14
Immigrants | Sweden
0.2
/100
|
#300
Tragic
3.14

Demographics Similar to Afghans by Average Family Size

In terms of average family size, the demographic groups most similar to Afghans are Jamaican (3.31, a difference of 0.020%), Immigrants from Nigeria (3.32, a difference of 0.040%), Immigrants from Peru (3.31, a difference of 0.070%), Immigrants from Afghanistan (3.32, a difference of 0.080%), and Ecuadorian (3.32, a difference of 0.090%).
DemographicsRating | RankAverage Family Size
Immigrants | Micronesia
99.8
/100
|
#78
Exceptional
3.32
British West Indians
99.8
/100
|
#79
Exceptional
3.32
Lumbee
99.8
/100
|
#80
Exceptional
3.32
Immigrants | Dominica
99.8
/100
|
#81
Exceptional
3.32
Ecuadorians
99.8
/100
|
#82
Exceptional
3.32
Immigrants | Afghanistan
99.8
/100
|
#83
Exceptional
3.32
Immigrants | Nigeria
99.7
/100
|
#84
Exceptional
3.32
Afghans
99.7
/100
|
#85
Exceptional
3.31
Jamaicans
99.7
/100
|
#86
Exceptional
3.31
Immigrants | Peru
99.7
/100
|
#87
Exceptional
3.31
Immigrants | Bolivia
99.6
/100
|
#88
Exceptional
3.31
Malaysians
99.6
/100
|
#89
Exceptional
3.31
Menominee
99.4
/100
|
#90
Exceptional
3.30
Immigrants | Pakistan
99.2
/100
|
#91
Exceptional
3.30
Immigrants | Cameroon
99.2
/100
|
#92
Exceptional
3.30