Scandinavian vs French Average Family Size
COMPARE
Scandinavian
French
Average Family Size
Average Family Size Comparison
Scandinavians
French
3.14
AVERAGE FAMILY SIZE
0.2/ 100
METRIC RATING
293rd/ 347
METRIC RANK
3.10
AVERAGE FAMILY SIZE
0.0/ 100
METRIC RATING
338th/ 347
METRIC RANK
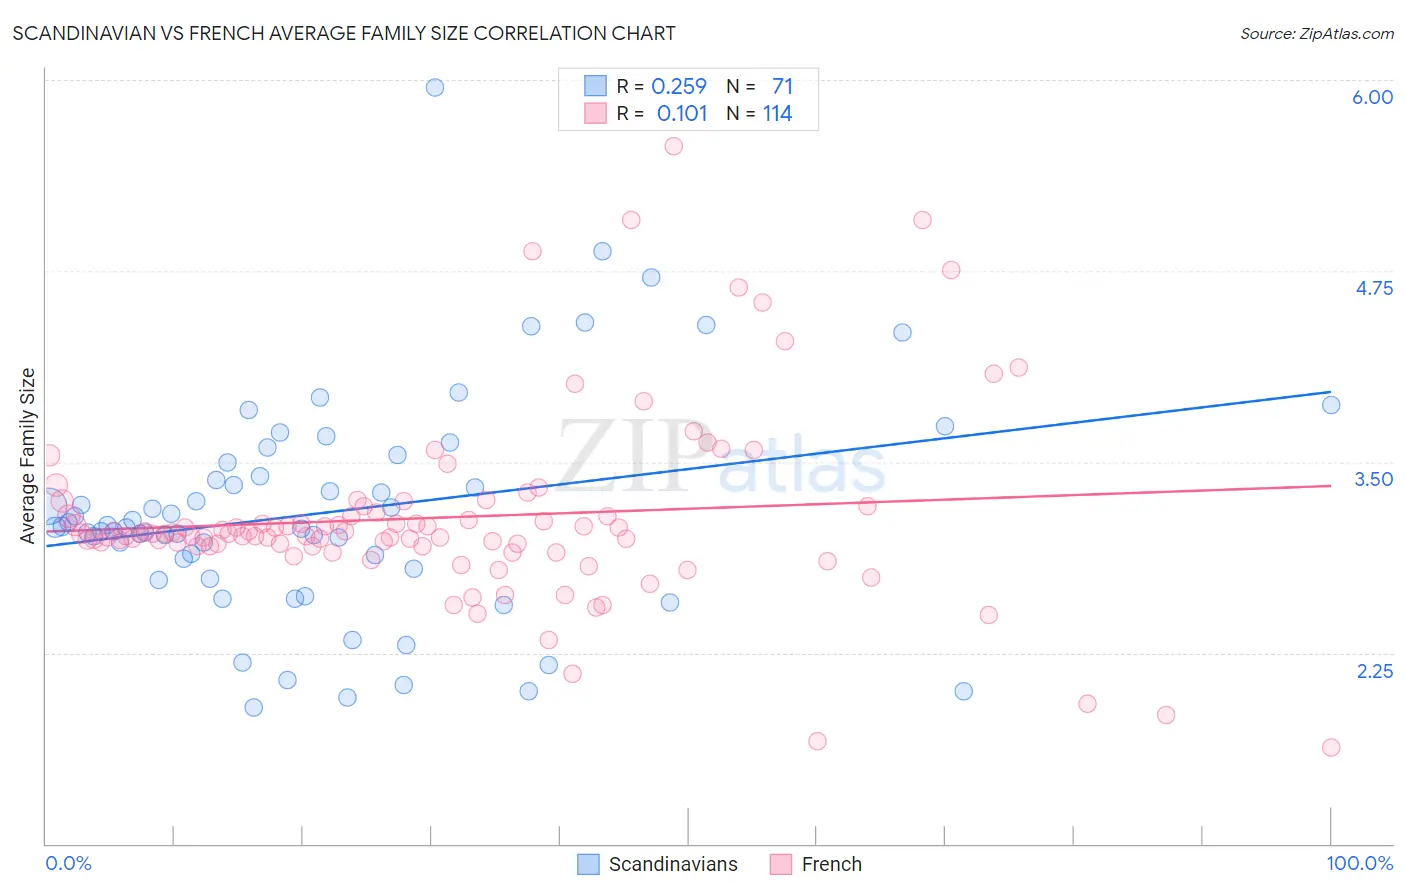
Scandinavian vs French Average Family Size Correlation Chart
The statistical analysis conducted on geographies consisting of 472,285,775 people shows a weak positive correlation between the proportion of Scandinavians and average family size in the United States with a correlation coefficient (R) of 0.259 and weighted average of 3.14. Similarly, the statistical analysis conducted on geographies consisting of 571,815,188 people shows a poor positive correlation between the proportion of French and average family size in the United States with a correlation coefficient (R) of 0.101 and weighted average of 3.10, a difference of 1.3%.
Average Family Size Correlation Summary
| Measurement | Scandinavian | French |
| Minimum | 1.89 | 1.63 |
| Maximum | 5.95 | 5.57 |
| Range | 4.06 | 3.94 |
| Mean | 3.17 | 3.14 |
| Median | 3.07 | 3.03 |
| Interquartile 25% (IQ1) | 2.80 | 2.95 |
| Interquartile 75% (IQ3) | 3.49 | 3.17 |
| Interquartile Range (IQR) | 0.69 | 0.22 |
| Standard Deviation (Sample) | 0.73 | 0.62 |
| Standard Deviation (Population) | 0.72 | 0.62 |
Similar Demographics by Average Family Size
Demographics Similar to Scandinavians by Average Family Size
In terms of average family size, the demographic groups most similar to Scandinavians are European (3.14, a difference of 0.010%), Immigrants from Croatia (3.14, a difference of 0.020%), Alsatian (3.14, a difference of 0.030%), Austrian (3.14, a difference of 0.030%), and Ukrainian (3.14, a difference of 0.030%).
| Demographics | Rating | Rank | Average Family Size |
| Immigrants | Netherlands | 0.3 /100 | #286 | Tragic 3.14 |
| Greeks | 0.3 /100 | #287 | Tragic 3.14 |
| Immigrants | Czechoslovakia | 0.3 /100 | #288 | Tragic 3.14 |
| Immigrants | Norway | 0.3 /100 | #289 | Tragic 3.14 |
| Cypriots | 0.3 /100 | #290 | Tragic 3.14 |
| Alsatians | 0.2 /100 | #291 | Tragic 3.14 |
| Europeans | 0.2 /100 | #292 | Tragic 3.14 |
| Scandinavians | 0.2 /100 | #293 | Tragic 3.14 |
| Immigrants | Croatia | 0.2 /100 | #294 | Tragic 3.14 |
| Austrians | 0.2 /100 | #295 | Tragic 3.14 |
| Ukrainians | 0.2 /100 | #296 | Tragic 3.14 |
| Immigrants | Western Europe | 0.2 /100 | #297 | Tragic 3.14 |
| Colville | 0.2 /100 | #298 | Tragic 3.14 |
| Canadians | 0.2 /100 | #299 | Tragic 3.14 |
| Immigrants | Sweden | 0.2 /100 | #300 | Tragic 3.14 |
Demographics Similar to French by Average Family Size
In terms of average family size, the demographic groups most similar to French are Croatian (3.10, a difference of 0.010%), Swedish (3.10, a difference of 0.020%), Irish (3.10, a difference of 0.060%), Luxembourger (3.10, a difference of 0.12%), and Estonian (3.10, a difference of 0.15%).
| Demographics | Rating | Rank | Average Family Size |
| Scotch-Irish | 0.0 /100 | #331 | Tragic 3.11 |
| Scottish | 0.0 /100 | #332 | Tragic 3.11 |
| Estonians | 0.0 /100 | #333 | Tragic 3.10 |
| Lithuanians | 0.0 /100 | #334 | Tragic 3.10 |
| Luxembourgers | 0.0 /100 | #335 | Tragic 3.10 |
| Irish | 0.0 /100 | #336 | Tragic 3.10 |
| Swedes | 0.0 /100 | #337 | Tragic 3.10 |
| French | 0.0 /100 | #338 | Tragic 3.10 |
| Croatians | 0.0 /100 | #339 | Tragic 3.10 |
| Finns | 0.0 /100 | #340 | Tragic 3.09 |
| Poles | 0.0 /100 | #341 | Tragic 3.09 |
| Germans | 0.0 /100 | #342 | Tragic 3.09 |
| Norwegians | 0.0 /100 | #343 | Tragic 3.08 |
| French Canadians | 0.0 /100 | #344 | Tragic 3.07 |
| Slovenes | 0.0 /100 | #345 | Tragic 3.07 |