Scandinavian vs Okinawan Average Family Size
COMPARE
Scandinavian
Okinawan
Average Family Size
Average Family Size Comparison
Scandinavians
Okinawans
3.14
AVERAGE FAMILY SIZE
0.2/ 100
METRIC RATING
293rd/ 347
METRIC RANK
3.15
AVERAGE FAMILY SIZE
0.5/ 100
METRIC RATING
278th/ 347
METRIC RANK
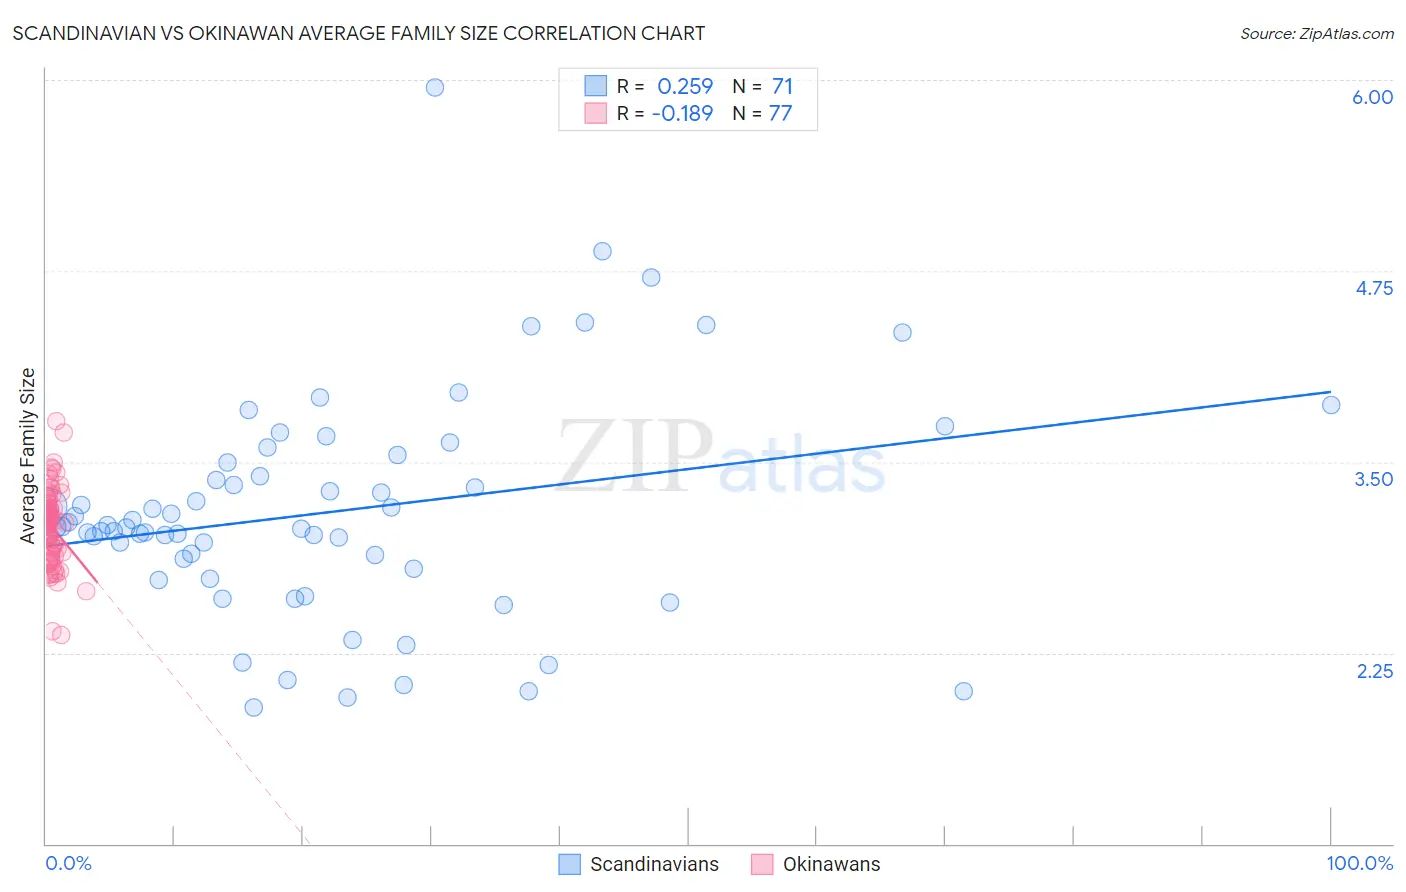
Scandinavian vs Okinawan Average Family Size Correlation Chart
The statistical analysis conducted on geographies consisting of 472,285,775 people shows a weak positive correlation between the proportion of Scandinavians and average family size in the United States with a correlation coefficient (R) of 0.259 and weighted average of 3.14. Similarly, the statistical analysis conducted on geographies consisting of 73,730,021 people shows a poor negative correlation between the proportion of Okinawans and average family size in the United States with a correlation coefficient (R) of -0.189 and weighted average of 3.15, a difference of 0.33%.
Average Family Size Correlation Summary
| Measurement | Scandinavian | Okinawan |
| Minimum | 1.89 | 2.37 |
| Maximum | 5.95 | 3.77 |
| Range | 4.06 | 1.40 |
| Mean | 3.17 | 3.08 |
| Median | 3.07 | 3.10 |
| Interquartile 25% (IQ1) | 2.80 | 2.91 |
| Interquartile 75% (IQ3) | 3.49 | 3.21 |
| Interquartile Range (IQR) | 0.69 | 0.30 |
| Standard Deviation (Sample) | 0.73 | 0.25 |
| Standard Deviation (Population) | 0.72 | 0.25 |
Demographics Similar to Scandinavians and Okinawans by Average Family Size
In terms of average family size, the demographic groups most similar to Scandinavians are European (3.14, a difference of 0.010%), Immigrants from Croatia (3.14, a difference of 0.020%), Alsatian (3.14, a difference of 0.030%), Austrian (3.14, a difference of 0.030%), and Cypriot (3.14, a difference of 0.070%). Similarly, the demographic groups most similar to Okinawans are Immigrants from Europe (3.15, a difference of 0.020%), Swiss (3.15, a difference of 0.030%), Immigrants from Bosnia and Herzegovina (3.15, a difference of 0.040%), Immigrants from England (3.15, a difference of 0.040%), and Immigrants from Denmark (3.15, a difference of 0.080%).
| Demographics | Rating | Rank | Average Family Size |
| Cambodians | 0.6 /100 | #275 | Tragic 3.15 |
| Immigrants | Bosnia and Herzegovina | 0.5 /100 | #276 | Tragic 3.15 |
| Swiss | 0.5 /100 | #277 | Tragic 3.15 |
| Okinawans | 0.5 /100 | #278 | Tragic 3.15 |
| Immigrants | Europe | 0.5 /100 | #279 | Tragic 3.15 |
| Immigrants | England | 0.4 /100 | #280 | Tragic 3.15 |
| Immigrants | Denmark | 0.4 /100 | #281 | Tragic 3.15 |
| Yugoslavians | 0.4 /100 | #282 | Tragic 3.15 |
| German Russians | 0.4 /100 | #283 | Tragic 3.15 |
| Immigrants | France | 0.4 /100 | #284 | Tragic 3.15 |
| Whites/Caucasians | 0.3 /100 | #285 | Tragic 3.14 |
| Immigrants | Netherlands | 0.3 /100 | #286 | Tragic 3.14 |
| Greeks | 0.3 /100 | #287 | Tragic 3.14 |
| Immigrants | Czechoslovakia | 0.3 /100 | #288 | Tragic 3.14 |
| Immigrants | Norway | 0.3 /100 | #289 | Tragic 3.14 |
| Cypriots | 0.3 /100 | #290 | Tragic 3.14 |
| Alsatians | 0.2 /100 | #291 | Tragic 3.14 |
| Europeans | 0.2 /100 | #292 | Tragic 3.14 |
| Scandinavians | 0.2 /100 | #293 | Tragic 3.14 |
| Immigrants | Croatia | 0.2 /100 | #294 | Tragic 3.14 |
| Austrians | 0.2 /100 | #295 | Tragic 3.14 |