Scandinavian vs Thai Average Family Size
COMPARE
Scandinavian
Thai
Average Family Size
Average Family Size Comparison
Scandinavians
Thais
3.14
AVERAGE FAMILY SIZE
0.2/ 100
METRIC RATING
293rd/ 347
METRIC RANK
3.22
AVERAGE FAMILY SIZE
38.3/ 100
METRIC RATING
188th/ 347
METRIC RANK
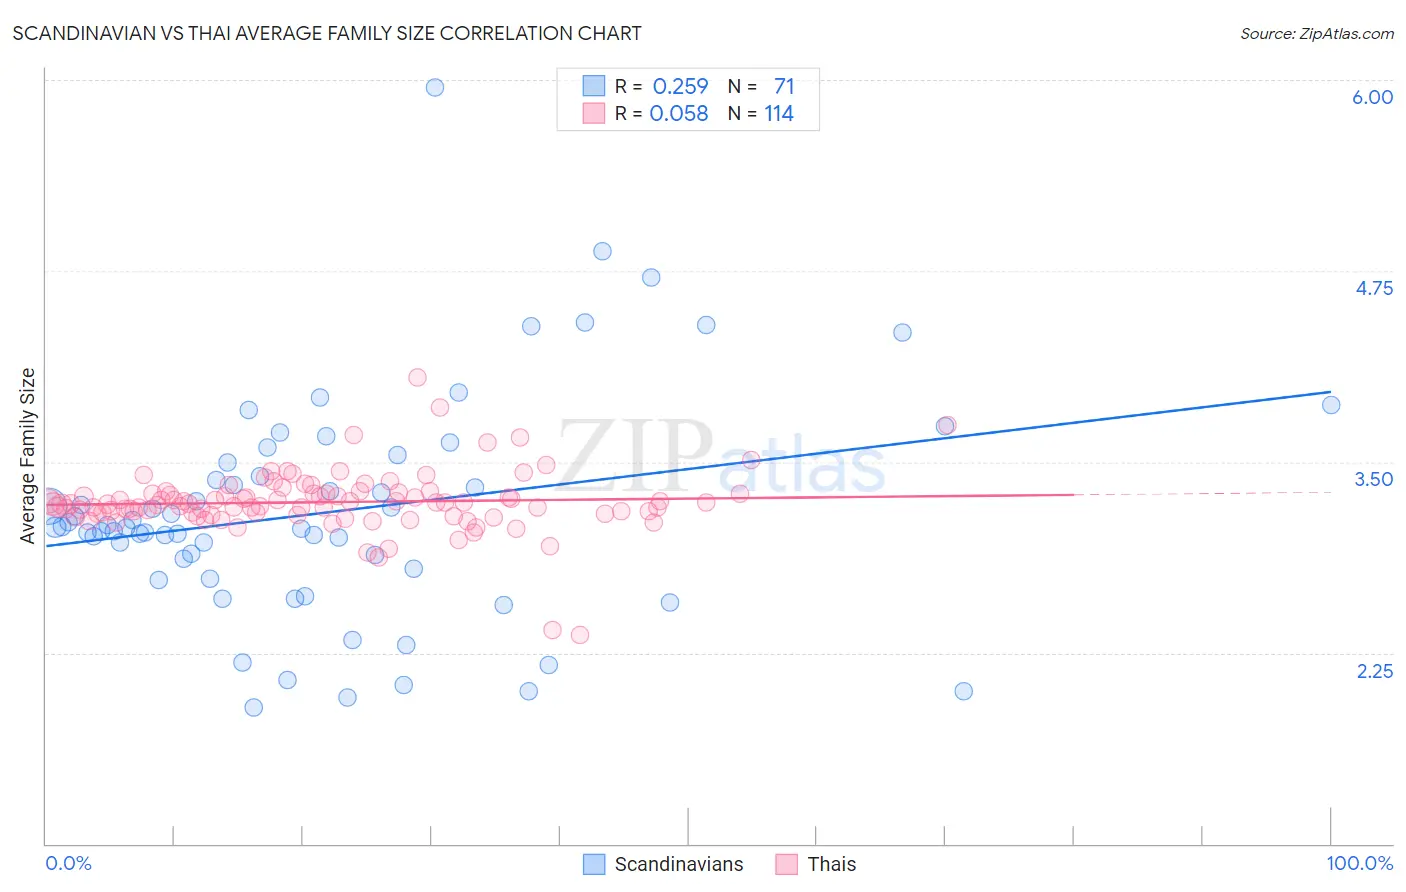
Scandinavian vs Thai Average Family Size Correlation Chart
The statistical analysis conducted on geographies consisting of 472,285,775 people shows a weak positive correlation between the proportion of Scandinavians and average family size in the United States with a correlation coefficient (R) of 0.259 and weighted average of 3.14. Similarly, the statistical analysis conducted on geographies consisting of 475,374,663 people shows a slight positive correlation between the proportion of Thais and average family size in the United States with a correlation coefficient (R) of 0.058 and weighted average of 3.22, a difference of 2.6%.
Average Family Size Correlation Summary
| Measurement | Scandinavian | Thai |
| Minimum | 1.89 | 2.37 |
| Maximum | 5.95 | 4.05 |
| Range | 4.06 | 1.68 |
| Mean | 3.17 | 3.24 |
| Median | 3.07 | 3.22 |
| Interquartile 25% (IQ1) | 2.80 | 3.16 |
| Interquartile 75% (IQ3) | 3.49 | 3.29 |
| Interquartile Range (IQR) | 0.69 | 0.13 |
| Standard Deviation (Sample) | 0.73 | 0.20 |
| Standard Deviation (Population) | 0.72 | 0.20 |
Similar Demographics by Average Family Size
Demographics Similar to Scandinavians by Average Family Size
In terms of average family size, the demographic groups most similar to Scandinavians are European (3.14, a difference of 0.010%), Immigrants from Croatia (3.14, a difference of 0.020%), Alsatian (3.14, a difference of 0.030%), Austrian (3.14, a difference of 0.030%), and Ukrainian (3.14, a difference of 0.030%).
| Demographics | Rating | Rank | Average Family Size |
| Immigrants | Netherlands | 0.3 /100 | #286 | Tragic 3.14 |
| Greeks | 0.3 /100 | #287 | Tragic 3.14 |
| Immigrants | Czechoslovakia | 0.3 /100 | #288 | Tragic 3.14 |
| Immigrants | Norway | 0.3 /100 | #289 | Tragic 3.14 |
| Cypriots | 0.3 /100 | #290 | Tragic 3.14 |
| Alsatians | 0.2 /100 | #291 | Tragic 3.14 |
| Europeans | 0.2 /100 | #292 | Tragic 3.14 |
| Scandinavians | 0.2 /100 | #293 | Tragic 3.14 |
| Immigrants | Croatia | 0.2 /100 | #294 | Tragic 3.14 |
| Austrians | 0.2 /100 | #295 | Tragic 3.14 |
| Ukrainians | 0.2 /100 | #296 | Tragic 3.14 |
| Immigrants | Western Europe | 0.2 /100 | #297 | Tragic 3.14 |
| Colville | 0.2 /100 | #298 | Tragic 3.14 |
| Canadians | 0.2 /100 | #299 | Tragic 3.14 |
| Immigrants | Sweden | 0.2 /100 | #300 | Tragic 3.14 |
Demographics Similar to Thais by Average Family Size
In terms of average family size, the demographic groups most similar to Thais are Immigrants from Malaysia (3.22, a difference of 0.010%), Immigrants from Sri Lanka (3.22, a difference of 0.030%), Immigrants from Argentina (3.22, a difference of 0.030%), Immigrants from Eastern Asia (3.22, a difference of 0.050%), and Immigrants from Northern Africa (3.22, a difference of 0.070%).
| Demographics | Rating | Rank | Average Family Size |
| Spanish | 44.8 /100 | #181 | Average 3.23 |
| Moroccans | 44.2 /100 | #182 | Average 3.22 |
| Immigrants | Northern Africa | 41.7 /100 | #183 | Average 3.22 |
| Immigrants | Eastern Asia | 40.8 /100 | #184 | Average 3.22 |
| Immigrants | Sri Lanka | 39.8 /100 | #185 | Fair 3.22 |
| Immigrants | Argentina | 39.8 /100 | #186 | Fair 3.22 |
| Immigrants | Malaysia | 39.0 /100 | #187 | Fair 3.22 |
| Thais | 38.3 /100 | #188 | Fair 3.22 |
| Pakistanis | 33.7 /100 | #189 | Fair 3.22 |
| Burmese | 31.0 /100 | #190 | Fair 3.22 |
| Immigrants | Zaire | 30.5 /100 | #191 | Fair 3.22 |
| Immigrants | Eastern Africa | 30.1 /100 | #192 | Fair 3.22 |
| Immigrants | Israel | 29.3 /100 | #193 | Fair 3.22 |
| Immigrants | Sudan | 29.1 /100 | #194 | Fair 3.22 |
| Choctaw | 28.3 /100 | #195 | Fair 3.21 |