Pima vs Immigrants from Lithuania Family Households
COMPARE
Pima
Immigrants from Lithuania
Family Households
Family Households Comparison
Pima
Immigrants from Lithuania
65.9%
FAMILY HOUSEHOLDS
99.9/ 100
METRIC RATING
64th/ 347
METRIC RANK
63.9%
FAMILY HOUSEHOLDS
12.1/ 100
METRIC RATING
206th/ 347
METRIC RANK
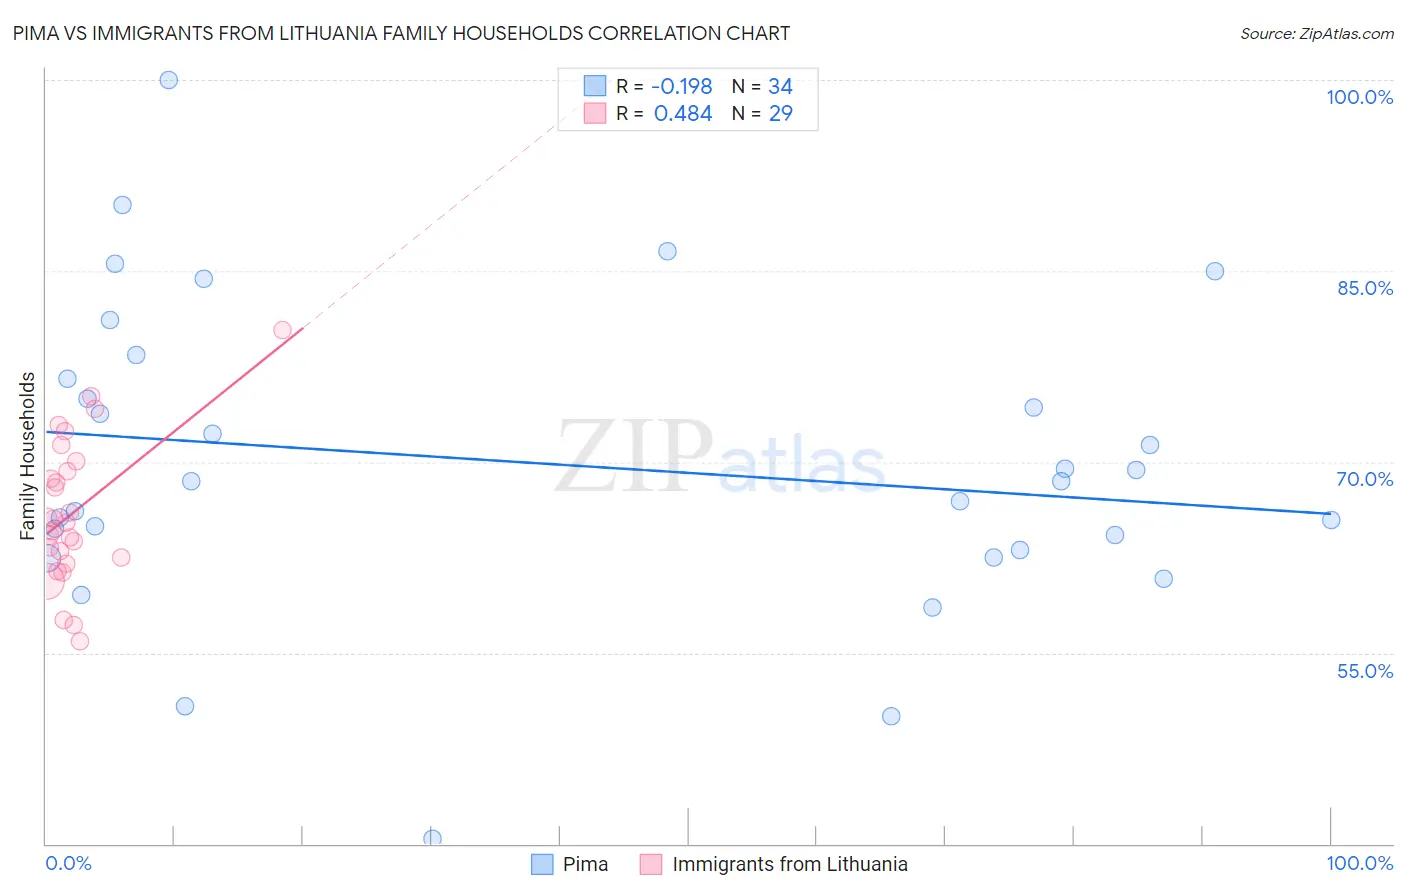
Pima vs Immigrants from Lithuania Family Households Correlation Chart
The statistical analysis conducted on geographies consisting of 61,539,566 people shows a poor negative correlation between the proportion of Pima and percentage of family households in the United States with a correlation coefficient (R) of -0.198 and weighted average of 65.9%. Similarly, the statistical analysis conducted on geographies consisting of 117,713,482 people shows a moderate positive correlation between the proportion of Immigrants from Lithuania and percentage of family households in the United States with a correlation coefficient (R) of 0.484 and weighted average of 63.9%, a difference of 3.2%.
Family Households Correlation Summary
| Measurement | Pima | Immigrants from Lithuania |
| Minimum | 40.4% | 55.9% |
| Maximum | 100.0% | 80.4% |
| Range | 59.6% | 24.4% |
| Mean | 69.9% | 66.0% |
| Median | 68.5% | 65.2% |
| Interquartile 25% (IQ1) | 63.1% | 62.3% |
| Interquartile 75% (IQ3) | 76.5% | 69.6% |
| Interquartile Range (IQR) | 13.5% | 7.4% |
| Standard Deviation (Sample) | 12.1% | 5.7% |
| Standard Deviation (Population) | 11.9% | 5.6% |
Similar Demographics by Family Households
Demographics Similar to Pima by Family Households
In terms of family households, the demographic groups most similar to Pima are Costa Rican (65.9%, a difference of 0.010%), Fijian (65.9%, a difference of 0.050%), Filipino (65.9%, a difference of 0.050%), Immigrants from Indonesia (66.0%, a difference of 0.060%), and Japanese (65.9%, a difference of 0.070%).
| Demographics | Rating | Rank | Family Households |
| Pennsylvania Germans | 100.0 /100 | #57 | Exceptional 66.1% |
| Immigrants | Asia | 100.0 /100 | #58 | Exceptional 66.1% |
| Immigrants | Korea | 100.0 /100 | #59 | Exceptional 66.0% |
| South Americans | 100.0 /100 | #60 | Exceptional 66.0% |
| Danes | 100.0 /100 | #61 | Exceptional 66.0% |
| Central Americans | 100.0 /100 | #62 | Exceptional 66.0% |
| Immigrants | Indonesia | 100.0 /100 | #63 | Exceptional 66.0% |
| Pima | 99.9 /100 | #64 | Exceptional 65.9% |
| Costa Ricans | 99.9 /100 | #65 | Exceptional 65.9% |
| Fijians | 99.9 /100 | #66 | Exceptional 65.9% |
| Filipinos | 99.9 /100 | #67 | Exceptional 65.9% |
| Japanese | 99.9 /100 | #68 | Exceptional 65.9% |
| Malaysians | 99.9 /100 | #69 | Exceptional 65.9% |
| Immigrants | Afghanistan | 99.9 /100 | #70 | Exceptional 65.9% |
| Bhutanese | 99.9 /100 | #71 | Exceptional 65.9% |
Demographics Similar to Immigrants from Lithuania by Family Households
In terms of family households, the demographic groups most similar to Immigrants from Lithuania are Brazilian (63.9%, a difference of 0.010%), Immigrants from Uruguay (63.9%, a difference of 0.020%), Nigerian (63.9%, a difference of 0.020%), Immigrants from Bangladesh (63.9%, a difference of 0.020%), and Norwegian (63.9%, a difference of 0.030%).
| Demographics | Rating | Rank | Family Households |
| Slavs | 18.6 /100 | #199 | Poor 64.0% |
| Immigrants | Malaysia | 17.9 /100 | #200 | Poor 64.0% |
| Immigrants | Eastern Europe | 17.2 /100 | #201 | Poor 64.0% |
| Iranians | 13.5 /100 | #202 | Poor 63.9% |
| Norwegians | 13.2 /100 | #203 | Poor 63.9% |
| Immigrants | Uruguay | 12.8 /100 | #204 | Poor 63.9% |
| Brazilians | 12.4 /100 | #205 | Poor 63.9% |
| Immigrants | Lithuania | 12.1 /100 | #206 | Poor 63.9% |
| Nigerians | 11.5 /100 | #207 | Poor 63.9% |
| Immigrants | Bangladesh | 11.4 /100 | #208 | Poor 63.9% |
| Sierra Leoneans | 11.2 /100 | #209 | Poor 63.9% |
| Immigrants | Thailand | 9.6 /100 | #210 | Tragic 63.8% |
| Shoshone | 9.4 /100 | #211 | Tragic 63.8% |
| Immigrants | Netherlands | 9.4 /100 | #212 | Tragic 63.8% |
| Immigrants | Northern Europe | 8.8 /100 | #213 | Tragic 63.8% |