African vs Immigrants from Lithuania Family Households
COMPARE
African
Immigrants from Lithuania
Family Households
Family Households Comparison
Africans
Immigrants from Lithuania
62.1%
FAMILY HOUSEHOLDS
0.0/ 100
METRIC RATING
306th/ 347
METRIC RANK
63.9%
FAMILY HOUSEHOLDS
12.1/ 100
METRIC RATING
206th/ 347
METRIC RANK
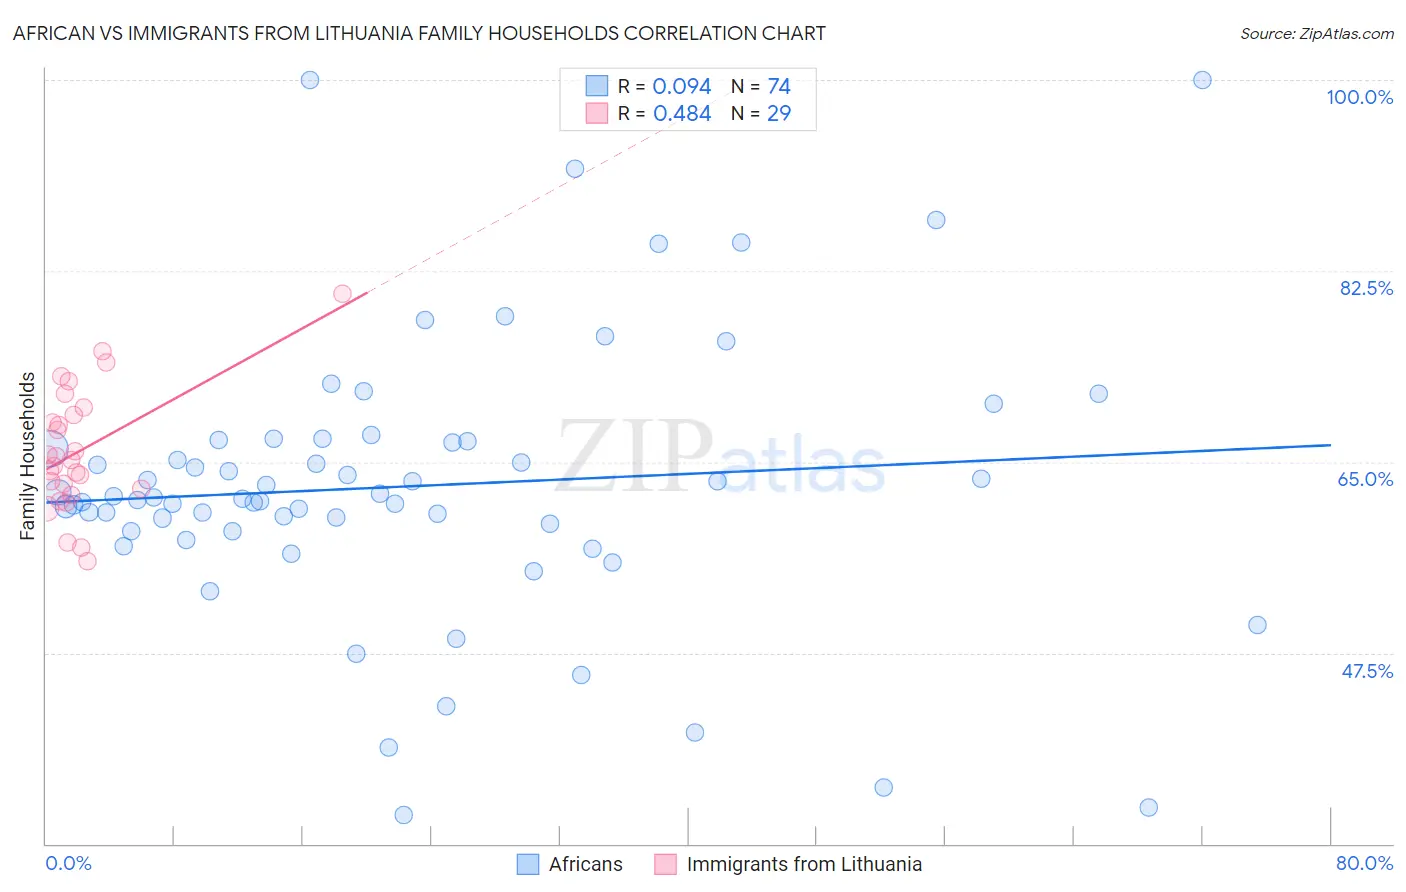
African vs Immigrants from Lithuania Family Households Correlation Chart
The statistical analysis conducted on geographies consisting of 469,598,671 people shows a slight positive correlation between the proportion of Africans and percentage of family households in the United States with a correlation coefficient (R) of 0.094 and weighted average of 62.1%. Similarly, the statistical analysis conducted on geographies consisting of 117,713,482 people shows a moderate positive correlation between the proportion of Immigrants from Lithuania and percentage of family households in the United States with a correlation coefficient (R) of 0.484 and weighted average of 63.9%, a difference of 2.8%.
Family Households Correlation Summary
| Measurement | African | Immigrants from Lithuania |
| Minimum | 32.6% | 55.9% |
| Maximum | 100.0% | 80.4% |
| Range | 67.4% | 24.4% |
| Mean | 62.8% | 66.0% |
| Median | 61.7% | 65.2% |
| Interquartile 25% (IQ1) | 58.7% | 62.3% |
| Interquartile 75% (IQ3) | 66.9% | 69.6% |
| Interquartile Range (IQR) | 8.2% | 7.4% |
| Standard Deviation (Sample) | 12.7% | 5.7% |
| Standard Deviation (Population) | 12.7% | 5.6% |
Similar Demographics by Family Households
Demographics Similar to Africans by Family Households
In terms of family households, the demographic groups most similar to Africans are Bermudan (62.2%, a difference of 0.020%), Immigrants from Norway (62.1%, a difference of 0.080%), Chippewa (62.1%, a difference of 0.080%), Subsaharan African (62.1%, a difference of 0.14%), and Iroquois (62.2%, a difference of 0.17%).
| Demographics | Rating | Rank | Family Households |
| Immigrants | Kuwait | 0.0 /100 | #299 | Tragic 62.4% |
| Immigrants | Africa | 0.0 /100 | #300 | Tragic 62.4% |
| Immigrants | Albania | 0.0 /100 | #301 | Tragic 62.4% |
| Immigrants | Kenya | 0.0 /100 | #302 | Tragic 62.3% |
| Cree | 0.0 /100 | #303 | Tragic 62.3% |
| Iroquois | 0.0 /100 | #304 | Tragic 62.2% |
| Bermudans | 0.0 /100 | #305 | Tragic 62.2% |
| Africans | 0.0 /100 | #306 | Tragic 62.1% |
| Immigrants | Norway | 0.0 /100 | #307 | Tragic 62.1% |
| Chippewa | 0.0 /100 | #308 | Tragic 62.1% |
| Sub-Saharan Africans | 0.0 /100 | #309 | Tragic 62.1% |
| Immigrants | Liberia | 0.0 /100 | #310 | Tragic 62.0% |
| Immigrants | Morocco | 0.0 /100 | #311 | Tragic 62.0% |
| Immigrants | Latvia | 0.0 /100 | #312 | Tragic 62.0% |
| Liberians | 0.0 /100 | #313 | Tragic 62.0% |
Demographics Similar to Immigrants from Lithuania by Family Households
In terms of family households, the demographic groups most similar to Immigrants from Lithuania are Brazilian (63.9%, a difference of 0.010%), Immigrants from Uruguay (63.9%, a difference of 0.020%), Nigerian (63.9%, a difference of 0.020%), Immigrants from Bangladesh (63.9%, a difference of 0.020%), and Norwegian (63.9%, a difference of 0.030%).
| Demographics | Rating | Rank | Family Households |
| Slavs | 18.6 /100 | #199 | Poor 64.0% |
| Immigrants | Malaysia | 17.9 /100 | #200 | Poor 64.0% |
| Immigrants | Eastern Europe | 17.2 /100 | #201 | Poor 64.0% |
| Iranians | 13.5 /100 | #202 | Poor 63.9% |
| Norwegians | 13.2 /100 | #203 | Poor 63.9% |
| Immigrants | Uruguay | 12.8 /100 | #204 | Poor 63.9% |
| Brazilians | 12.4 /100 | #205 | Poor 63.9% |
| Immigrants | Lithuania | 12.1 /100 | #206 | Poor 63.9% |
| Nigerians | 11.5 /100 | #207 | Poor 63.9% |
| Immigrants | Bangladesh | 11.4 /100 | #208 | Poor 63.9% |
| Sierra Leoneans | 11.2 /100 | #209 | Poor 63.9% |
| Immigrants | Thailand | 9.6 /100 | #210 | Tragic 63.8% |
| Shoshone | 9.4 /100 | #211 | Tragic 63.8% |
| Immigrants | Netherlands | 9.4 /100 | #212 | Tragic 63.8% |
| Immigrants | Northern Europe | 8.8 /100 | #213 | Tragic 63.8% |