Samoan vs Immigrants from Lithuania Family Households
COMPARE
Samoan
Immigrants from Lithuania
Family Households
Family Households Comparison
Samoans
Immigrants from Lithuania
67.9%
FAMILY HOUSEHOLDS
100.0/ 100
METRIC RATING
19th/ 347
METRIC RANK
63.9%
FAMILY HOUSEHOLDS
12.1/ 100
METRIC RATING
206th/ 347
METRIC RANK
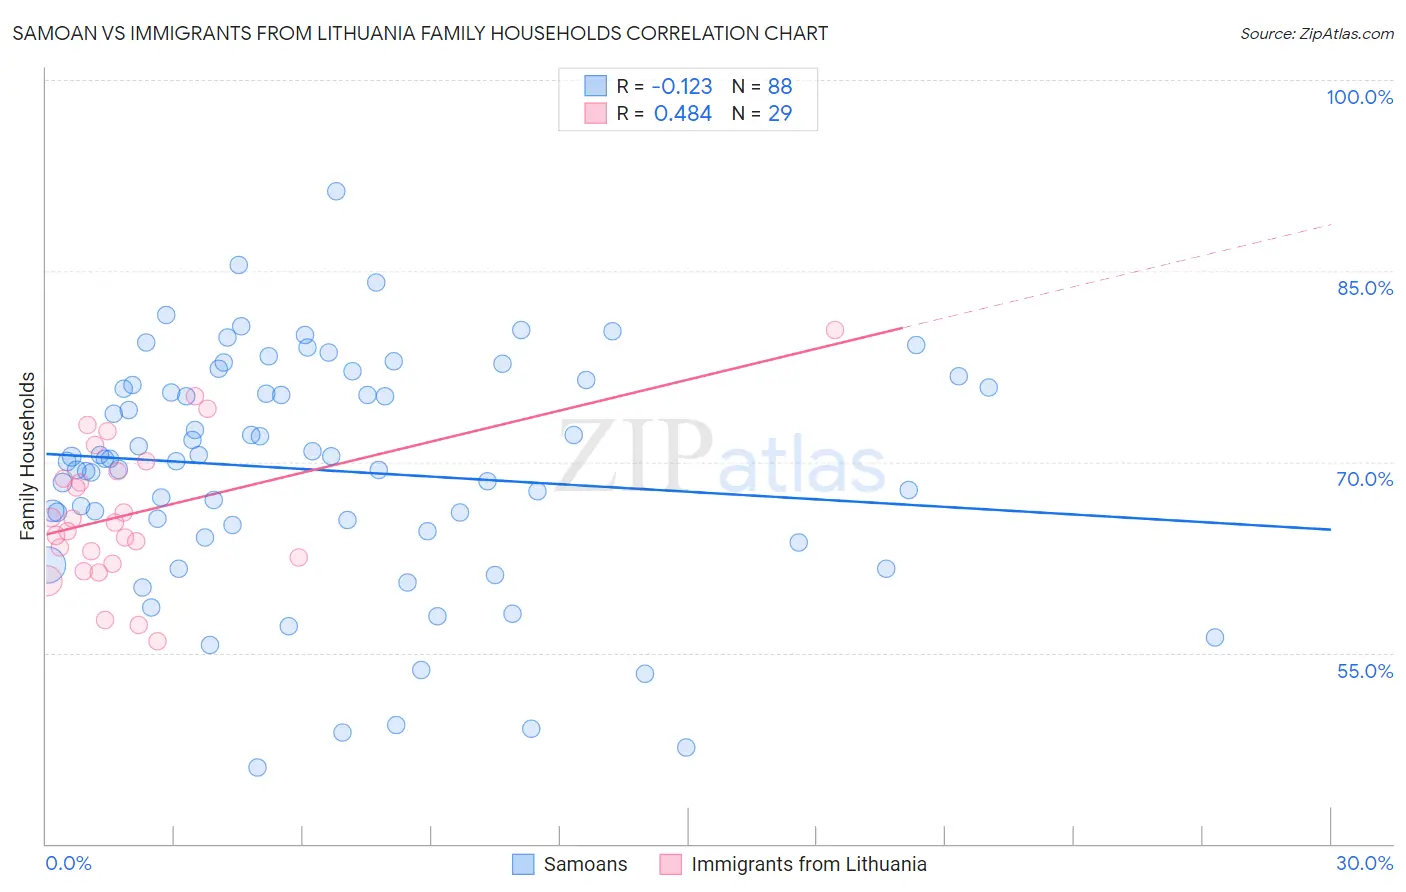
Samoan vs Immigrants from Lithuania Family Households Correlation Chart
The statistical analysis conducted on geographies consisting of 225,071,820 people shows a poor negative correlation between the proportion of Samoans and percentage of family households in the United States with a correlation coefficient (R) of -0.123 and weighted average of 67.9%. Similarly, the statistical analysis conducted on geographies consisting of 117,713,482 people shows a moderate positive correlation between the proportion of Immigrants from Lithuania and percentage of family households in the United States with a correlation coefficient (R) of 0.484 and weighted average of 63.9%, a difference of 6.4%.
Family Households Correlation Summary
| Measurement | Samoan | Immigrants from Lithuania |
| Minimum | 46.0% | 55.9% |
| Maximum | 91.2% | 80.4% |
| Range | 45.2% | 24.4% |
| Mean | 69.3% | 66.0% |
| Median | 70.2% | 65.2% |
| Interquartile 25% (IQ1) | 64.8% | 62.3% |
| Interquartile 75% (IQ3) | 75.9% | 69.6% |
| Interquartile Range (IQR) | 11.1% | 7.4% |
| Standard Deviation (Sample) | 9.1% | 5.7% |
| Standard Deviation (Population) | 9.1% | 5.6% |
Similar Demographics by Family Households
Demographics Similar to Samoans by Family Households
In terms of family households, the demographic groups most similar to Samoans are Immigrants from Taiwan (68.0%, a difference of 0.12%), Inupiat (67.8%, a difference of 0.25%), Chinese (68.1%, a difference of 0.28%), Cuban (67.7%, a difference of 0.30%), and Assyrian/Chaldean/Syriac (68.2%, a difference of 0.32%).
| Demographics | Rating | Rank | Family Households |
| Koreans | 100.0 /100 | #12 | Exceptional 68.3% |
| Pueblo | 100.0 /100 | #13 | Exceptional 68.2% |
| Immigrants | Cuba | 100.0 /100 | #14 | Exceptional 68.2% |
| Assyrians/Chaldeans/Syriacs | 100.0 /100 | #15 | Exceptional 68.2% |
| Immigrants | Vietnam | 100.0 /100 | #16 | Exceptional 68.2% |
| Chinese | 100.0 /100 | #17 | Exceptional 68.1% |
| Immigrants | Taiwan | 100.0 /100 | #18 | Exceptional 68.0% |
| Samoans | 100.0 /100 | #19 | Exceptional 67.9% |
| Inupiat | 100.0 /100 | #20 | Exceptional 67.8% |
| Cubans | 100.0 /100 | #21 | Exceptional 67.7% |
| Sri Lankans | 100.0 /100 | #22 | Exceptional 67.7% |
| Immigrants | Pakistan | 100.0 /100 | #23 | Exceptional 67.7% |
| Immigrants | South Eastern Asia | 100.0 /100 | #24 | Exceptional 67.5% |
| Immigrants | Nicaragua | 100.0 /100 | #25 | Exceptional 67.5% |
| Immigrants | India | 100.0 /100 | #26 | Exceptional 67.4% |
Demographics Similar to Immigrants from Lithuania by Family Households
In terms of family households, the demographic groups most similar to Immigrants from Lithuania are Brazilian (63.9%, a difference of 0.010%), Immigrants from Uruguay (63.9%, a difference of 0.020%), Nigerian (63.9%, a difference of 0.020%), Immigrants from Bangladesh (63.9%, a difference of 0.020%), and Norwegian (63.9%, a difference of 0.030%).
| Demographics | Rating | Rank | Family Households |
| Slavs | 18.6 /100 | #199 | Poor 64.0% |
| Immigrants | Malaysia | 17.9 /100 | #200 | Poor 64.0% |
| Immigrants | Eastern Europe | 17.2 /100 | #201 | Poor 64.0% |
| Iranians | 13.5 /100 | #202 | Poor 63.9% |
| Norwegians | 13.2 /100 | #203 | Poor 63.9% |
| Immigrants | Uruguay | 12.8 /100 | #204 | Poor 63.9% |
| Brazilians | 12.4 /100 | #205 | Poor 63.9% |
| Immigrants | Lithuania | 12.1 /100 | #206 | Poor 63.9% |
| Nigerians | 11.5 /100 | #207 | Poor 63.9% |
| Immigrants | Bangladesh | 11.4 /100 | #208 | Poor 63.9% |
| Sierra Leoneans | 11.2 /100 | #209 | Poor 63.9% |
| Immigrants | Thailand | 9.6 /100 | #210 | Tragic 63.8% |
| Shoshone | 9.4 /100 | #211 | Tragic 63.8% |
| Immigrants | Netherlands | 9.4 /100 | #212 | Tragic 63.8% |
| Immigrants | Northern Europe | 8.8 /100 | #213 | Tragic 63.8% |