Pima vs Comanche Family Households
COMPARE
Pima
Comanche
Family Households
Family Households Comparison
Pima
Comanche
65.9%
FAMILY HOUSEHOLDS
99.9/ 100
METRIC RATING
64th/ 347
METRIC RANK
63.5%
FAMILY HOUSEHOLDS
2.1/ 100
METRIC RATING
237th/ 347
METRIC RANK
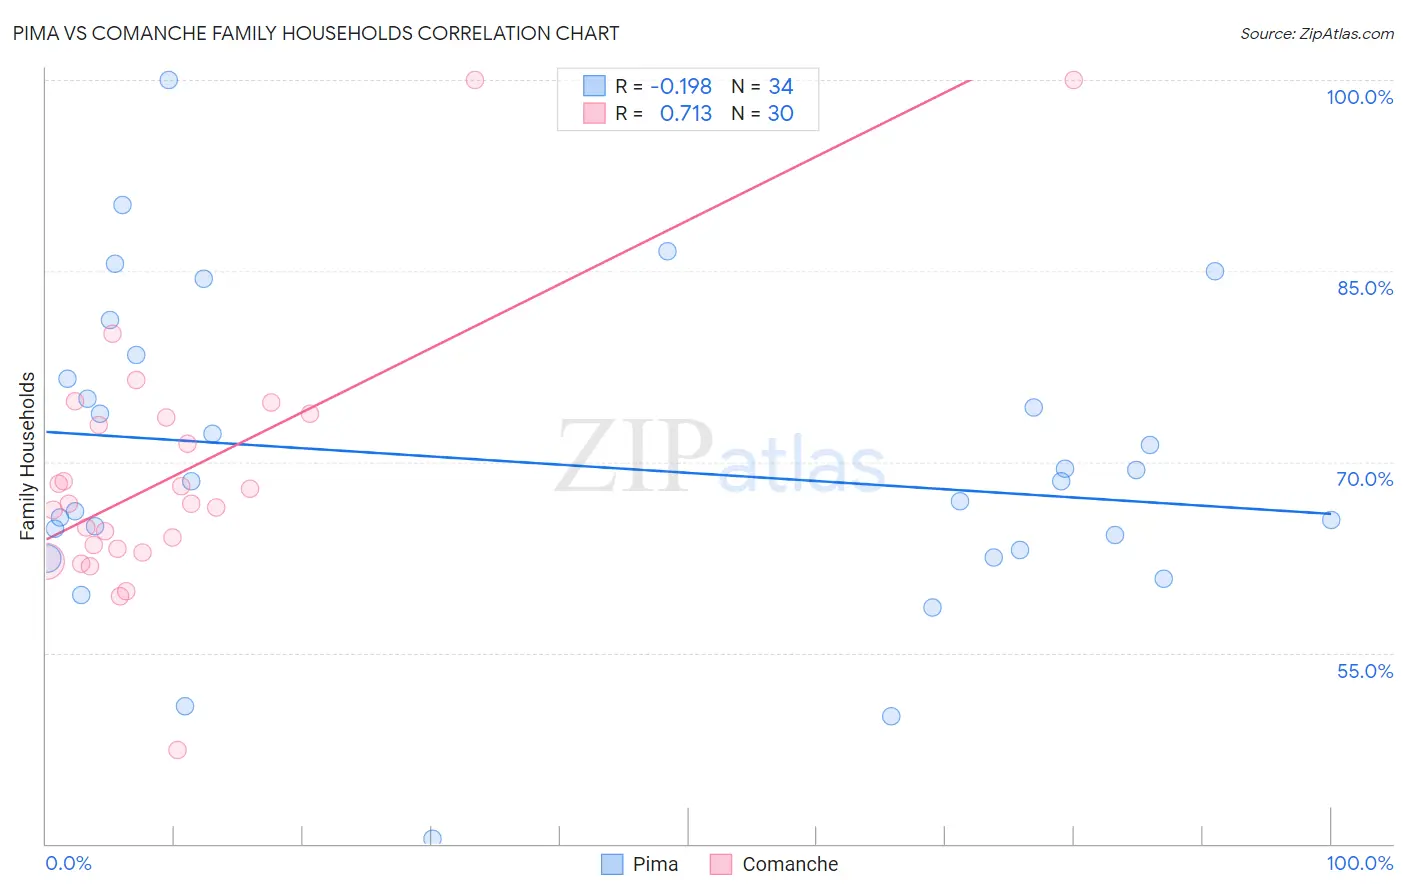
Pima vs Comanche Family Households Correlation Chart
The statistical analysis conducted on geographies consisting of 61,539,566 people shows a poor negative correlation between the proportion of Pima and percentage of family households in the United States with a correlation coefficient (R) of -0.198 and weighted average of 65.9%. Similarly, the statistical analysis conducted on geographies consisting of 109,767,909 people shows a strong positive correlation between the proportion of Comanche and percentage of family households in the United States with a correlation coefficient (R) of 0.713 and weighted average of 63.5%, a difference of 3.9%.
Family Households Correlation Summary
| Measurement | Pima | Comanche |
| Minimum | 40.4% | 47.4% |
| Maximum | 100.0% | 100.0% |
| Range | 59.6% | 52.6% |
| Mean | 69.9% | 69.1% |
| Median | 68.5% | 66.7% |
| Interquartile 25% (IQ1) | 63.1% | 63.2% |
| Interquartile 75% (IQ3) | 76.5% | 73.4% |
| Interquartile Range (IQR) | 13.5% | 10.3% |
| Standard Deviation (Sample) | 12.1% | 10.5% |
| Standard Deviation (Population) | 11.9% | 10.3% |
Similar Demographics by Family Households
Demographics Similar to Pima by Family Households
In terms of family households, the demographic groups most similar to Pima are Costa Rican (65.9%, a difference of 0.010%), Fijian (65.9%, a difference of 0.050%), Filipino (65.9%, a difference of 0.050%), Immigrants from Indonesia (66.0%, a difference of 0.060%), and Japanese (65.9%, a difference of 0.070%).
| Demographics | Rating | Rank | Family Households |
| Pennsylvania Germans | 100.0 /100 | #57 | Exceptional 66.1% |
| Immigrants | Asia | 100.0 /100 | #58 | Exceptional 66.1% |
| Immigrants | Korea | 100.0 /100 | #59 | Exceptional 66.0% |
| South Americans | 100.0 /100 | #60 | Exceptional 66.0% |
| Danes | 100.0 /100 | #61 | Exceptional 66.0% |
| Central Americans | 100.0 /100 | #62 | Exceptional 66.0% |
| Immigrants | Indonesia | 100.0 /100 | #63 | Exceptional 66.0% |
| Pima | 99.9 /100 | #64 | Exceptional 65.9% |
| Costa Ricans | 99.9 /100 | #65 | Exceptional 65.9% |
| Fijians | 99.9 /100 | #66 | Exceptional 65.9% |
| Filipinos | 99.9 /100 | #67 | Exceptional 65.9% |
| Japanese | 99.9 /100 | #68 | Exceptional 65.9% |
| Malaysians | 99.9 /100 | #69 | Exceptional 65.9% |
| Immigrants | Afghanistan | 99.9 /100 | #70 | Exceptional 65.9% |
| Bhutanese | 99.9 /100 | #71 | Exceptional 65.9% |
Demographics Similar to Comanche by Family Households
In terms of family households, the demographic groups most similar to Comanche are Ghanaian (63.5%, a difference of 0.0%), Immigrants from Zimbabwe (63.5%, a difference of 0.010%), Albanian (63.5%, a difference of 0.020%), Aleut (63.4%, a difference of 0.030%), and South African (63.4%, a difference of 0.030%).
| Demographics | Rating | Rank | Family Households |
| Immigrants | Brazil | 3.0 /100 | #230 | Tragic 63.6% |
| Immigrants | Greece | 2.9 /100 | #231 | Tragic 63.5% |
| Immigrants | Northern Africa | 2.6 /100 | #232 | Tragic 63.5% |
| Immigrants | Armenia | 2.6 /100 | #233 | Tragic 63.5% |
| Finns | 2.3 /100 | #234 | Tragic 63.5% |
| Albanians | 2.2 /100 | #235 | Tragic 63.5% |
| Ghanaians | 2.1 /100 | #236 | Tragic 63.5% |
| Comanche | 2.1 /100 | #237 | Tragic 63.5% |
| Immigrants | Zimbabwe | 2.0 /100 | #238 | Tragic 63.5% |
| Aleuts | 1.9 /100 | #239 | Tragic 63.4% |
| South Africans | 1.9 /100 | #240 | Tragic 63.4% |
| Immigrants | St. Vincent and the Grenadines | 1.9 /100 | #241 | Tragic 63.4% |
| Immigrants | Israel | 1.8 /100 | #242 | Tragic 63.4% |
| Immigrants | Czechoslovakia | 1.8 /100 | #243 | Tragic 63.4% |
| Eastern Europeans | 1.6 /100 | #244 | Tragic 63.4% |