Czech vs Immigrants from Lithuania Family Households
COMPARE
Czech
Immigrants from Lithuania
Family Households
Family Households Comparison
Czechs
Immigrants from Lithuania
64.5%
FAMILY HOUSEHOLDS
67.0/ 100
METRIC RATING
156th/ 347
METRIC RANK
63.9%
FAMILY HOUSEHOLDS
12.1/ 100
METRIC RATING
206th/ 347
METRIC RANK
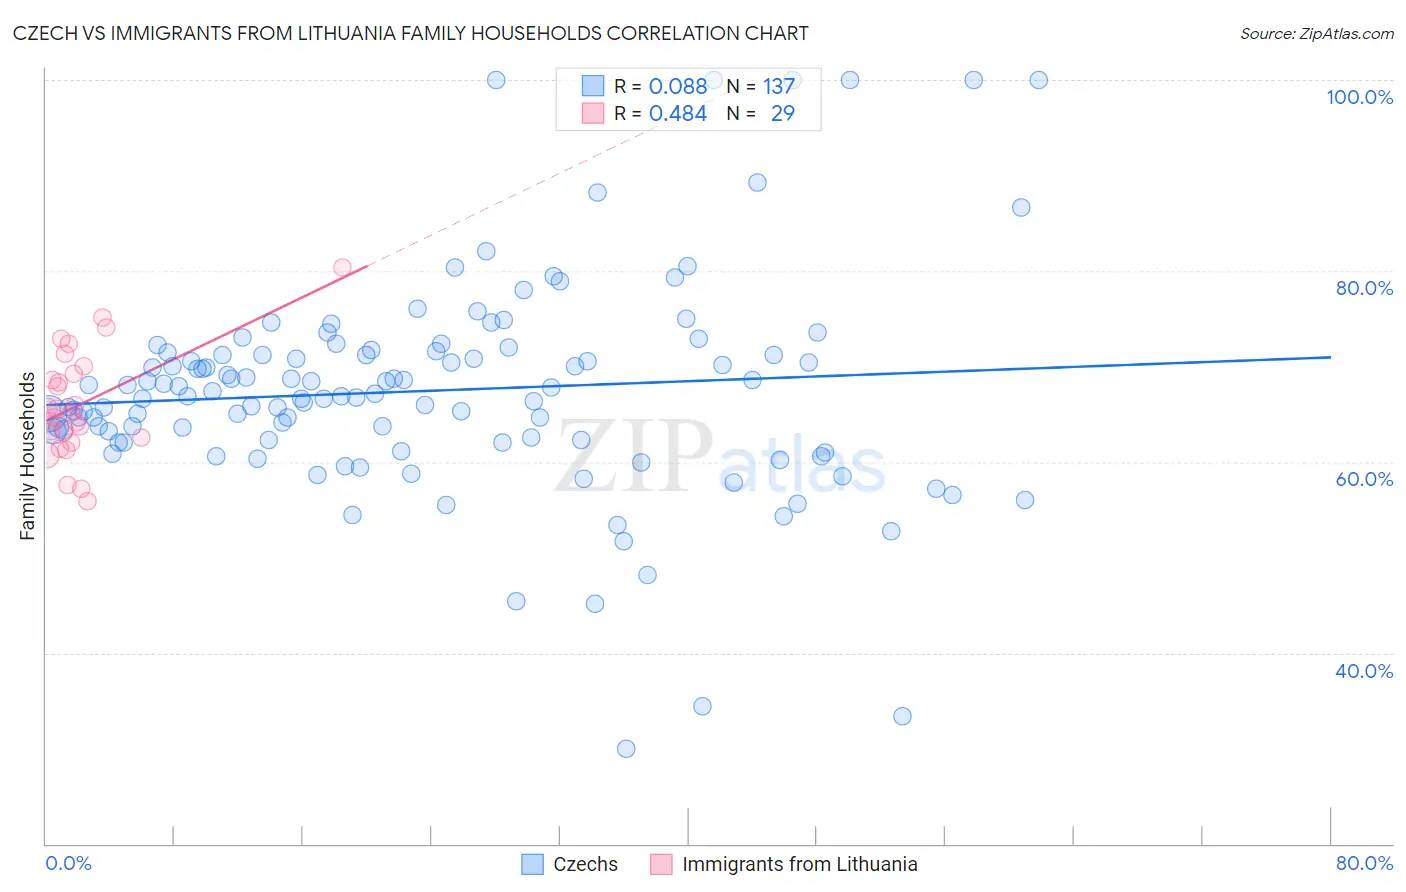
Czech vs Immigrants from Lithuania Family Households Correlation Chart
The statistical analysis conducted on geographies consisting of 484,475,433 people shows a slight positive correlation between the proportion of Czechs and percentage of family households in the United States with a correlation coefficient (R) of 0.088 and weighted average of 64.5%. Similarly, the statistical analysis conducted on geographies consisting of 117,713,482 people shows a moderate positive correlation between the proportion of Immigrants from Lithuania and percentage of family households in the United States with a correlation coefficient (R) of 0.484 and weighted average of 63.9%, a difference of 0.91%.
Family Households Correlation Summary
| Measurement | Czech | Immigrants from Lithuania |
| Minimum | 29.9% | 55.9% |
| Maximum | 100.0% | 80.4% |
| Range | 70.1% | 24.4% |
| Mean | 67.4% | 66.0% |
| Median | 66.9% | 65.2% |
| Interquartile 25% (IQ1) | 62.2% | 62.3% |
| Interquartile 75% (IQ3) | 71.4% | 69.6% |
| Interquartile Range (IQR) | 9.2% | 7.4% |
| Standard Deviation (Sample) | 11.4% | 5.7% |
| Standard Deviation (Population) | 11.3% | 5.6% |
Similar Demographics by Family Households
Demographics Similar to Czechs by Family Households
In terms of family households, the demographic groups most similar to Czechs are Uruguayan (64.5%, a difference of 0.010%), Canadian (64.4%, a difference of 0.010%), Lebanese (64.4%, a difference of 0.010%), Austrian (64.5%, a difference of 0.020%), and German (64.4%, a difference of 0.020%).
| Demographics | Rating | Rank | Family Households |
| Sioux | 76.3 /100 | #149 | Good 64.6% |
| Romanians | 75.3 /100 | #150 | Good 64.5% |
| Syrians | 75.2 /100 | #151 | Good 64.5% |
| Scottish | 70.9 /100 | #152 | Good 64.5% |
| Swedes | 69.8 /100 | #153 | Good 64.5% |
| Austrians | 68.5 /100 | #154 | Good 64.5% |
| Uruguayans | 67.7 /100 | #155 | Good 64.5% |
| Czechs | 67.0 /100 | #156 | Good 64.5% |
| Canadians | 66.6 /100 | #157 | Good 64.4% |
| Lebanese | 66.4 /100 | #158 | Good 64.4% |
| Germans | 65.8 /100 | #159 | Good 64.4% |
| Immigrants | Moldova | 65.2 /100 | #160 | Good 64.4% |
| Immigrants | England | 62.6 /100 | #161 | Good 64.4% |
| British | 61.6 /100 | #162 | Good 64.4% |
| Chickasaw | 61.5 /100 | #163 | Good 64.4% |
Demographics Similar to Immigrants from Lithuania by Family Households
In terms of family households, the demographic groups most similar to Immigrants from Lithuania are Brazilian (63.9%, a difference of 0.010%), Immigrants from Uruguay (63.9%, a difference of 0.020%), Nigerian (63.9%, a difference of 0.020%), Immigrants from Bangladesh (63.9%, a difference of 0.020%), and Norwegian (63.9%, a difference of 0.030%).
| Demographics | Rating | Rank | Family Households |
| Slavs | 18.6 /100 | #199 | Poor 64.0% |
| Immigrants | Malaysia | 17.9 /100 | #200 | Poor 64.0% |
| Immigrants | Eastern Europe | 17.2 /100 | #201 | Poor 64.0% |
| Iranians | 13.5 /100 | #202 | Poor 63.9% |
| Norwegians | 13.2 /100 | #203 | Poor 63.9% |
| Immigrants | Uruguay | 12.8 /100 | #204 | Poor 63.9% |
| Brazilians | 12.4 /100 | #205 | Poor 63.9% |
| Immigrants | Lithuania | 12.1 /100 | #206 | Poor 63.9% |
| Nigerians | 11.5 /100 | #207 | Poor 63.9% |
| Immigrants | Bangladesh | 11.4 /100 | #208 | Poor 63.9% |
| Sierra Leoneans | 11.2 /100 | #209 | Poor 63.9% |
| Immigrants | Thailand | 9.6 /100 | #210 | Tragic 63.8% |
| Shoshone | 9.4 /100 | #211 | Tragic 63.8% |
| Immigrants | Netherlands | 9.4 /100 | #212 | Tragic 63.8% |
| Immigrants | Northern Europe | 8.8 /100 | #213 | Tragic 63.8% |