Pima vs Native Hawaiian Family Households
COMPARE
Pima
Native Hawaiian
Family Households
Family Households Comparison
Pima
Native Hawaiians
65.9%
FAMILY HOUSEHOLDS
99.9/ 100
METRIC RATING
64th/ 347
METRIC RANK
68.4%
FAMILY HOUSEHOLDS
100.0/ 100
METRIC RATING
9th/ 347
METRIC RANK
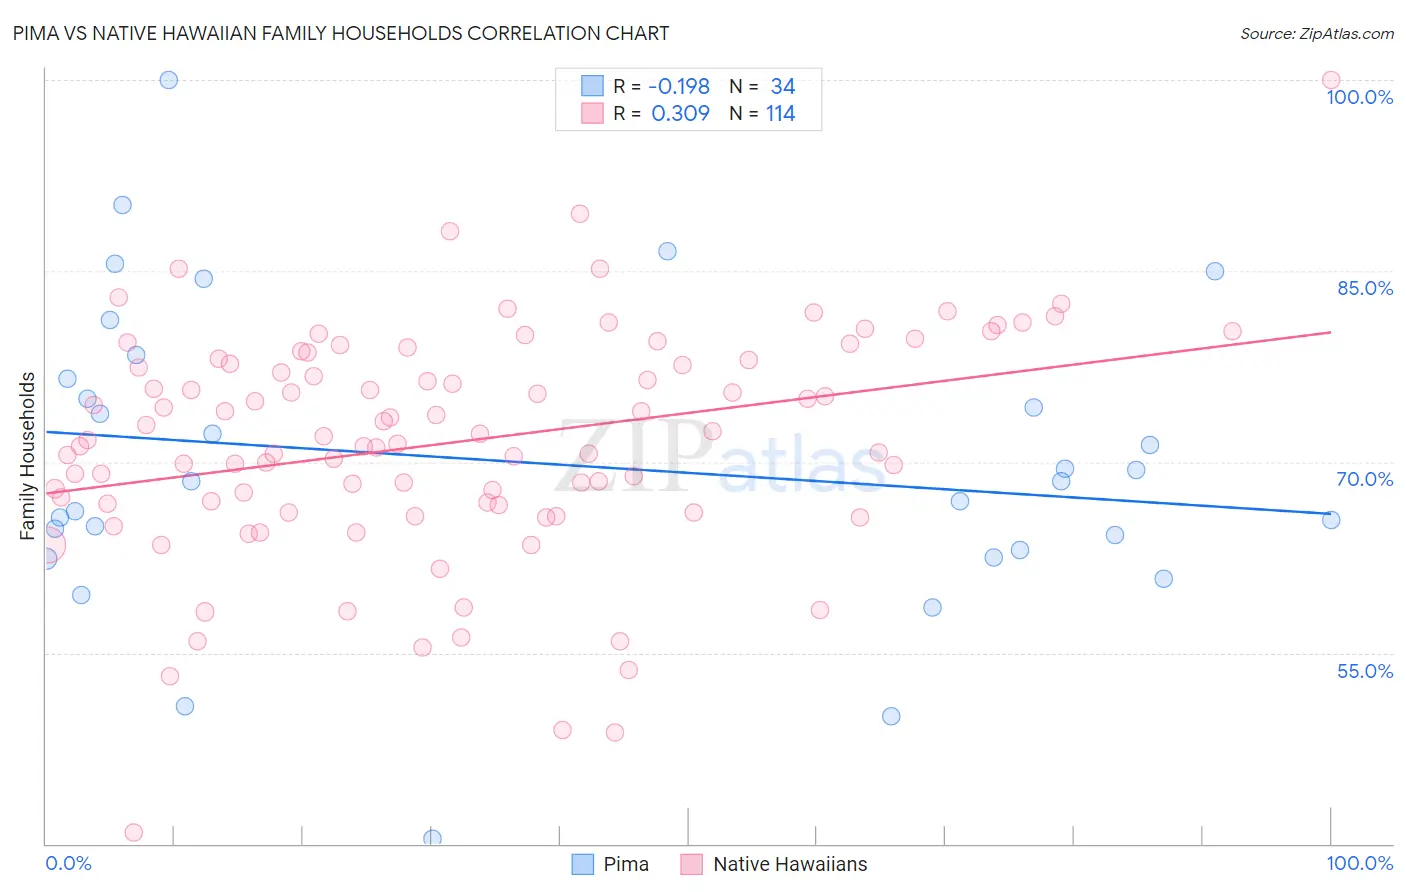
Pima vs Native Hawaiian Family Households Correlation Chart
The statistical analysis conducted on geographies consisting of 61,539,566 people shows a poor negative correlation between the proportion of Pima and percentage of family households in the United States with a correlation coefficient (R) of -0.198 and weighted average of 65.9%. Similarly, the statistical analysis conducted on geographies consisting of 331,876,640 people shows a mild positive correlation between the proportion of Native Hawaiians and percentage of family households in the United States with a correlation coefficient (R) of 0.309 and weighted average of 68.4%, a difference of 3.7%.
Family Households Correlation Summary
| Measurement | Pima | Native Hawaiian |
| Minimum | 40.4% | 40.9% |
| Maximum | 100.0% | 100.0% |
| Range | 59.6% | 59.1% |
| Mean | 69.9% | 71.6% |
| Median | 68.5% | 71.9% |
| Interquartile 25% (IQ1) | 63.1% | 66.7% |
| Interquartile 75% (IQ3) | 76.5% | 78.0% |
| Interquartile Range (IQR) | 13.5% | 11.3% |
| Standard Deviation (Sample) | 12.1% | 9.1% |
| Standard Deviation (Population) | 11.9% | 9.0% |
Similar Demographics by Family Households
Demographics Similar to Pima by Family Households
In terms of family households, the demographic groups most similar to Pima are Costa Rican (65.9%, a difference of 0.010%), Fijian (65.9%, a difference of 0.050%), Filipino (65.9%, a difference of 0.050%), Immigrants from Indonesia (66.0%, a difference of 0.060%), and Japanese (65.9%, a difference of 0.070%).
| Demographics | Rating | Rank | Family Households |
| Pennsylvania Germans | 100.0 /100 | #57 | Exceptional 66.1% |
| Immigrants | Asia | 100.0 /100 | #58 | Exceptional 66.1% |
| Immigrants | Korea | 100.0 /100 | #59 | Exceptional 66.0% |
| South Americans | 100.0 /100 | #60 | Exceptional 66.0% |
| Danes | 100.0 /100 | #61 | Exceptional 66.0% |
| Central Americans | 100.0 /100 | #62 | Exceptional 66.0% |
| Immigrants | Indonesia | 100.0 /100 | #63 | Exceptional 66.0% |
| Pima | 99.9 /100 | #64 | Exceptional 65.9% |
| Costa Ricans | 99.9 /100 | #65 | Exceptional 65.9% |
| Fijians | 99.9 /100 | #66 | Exceptional 65.9% |
| Filipinos | 99.9 /100 | #67 | Exceptional 65.9% |
| Japanese | 99.9 /100 | #68 | Exceptional 65.9% |
| Malaysians | 99.9 /100 | #69 | Exceptional 65.9% |
| Immigrants | Afghanistan | 99.9 /100 | #70 | Exceptional 65.9% |
| Bhutanese | 99.9 /100 | #71 | Exceptional 65.9% |
Demographics Similar to Native Hawaiians by Family Households
In terms of family households, the demographic groups most similar to Native Hawaiians are Immigrants from Philippines (68.3%, a difference of 0.070%), Immigrants from Central America (68.3%, a difference of 0.14%), Korean (68.3%, a difference of 0.17%), Pueblo (68.2%, a difference of 0.25%), and Immigrants from Cuba (68.2%, a difference of 0.26%).
| Demographics | Rating | Rank | Family Households |
| Spanish American Indians | 100.0 /100 | #2 | Exceptional 71.2% |
| Tongans | 100.0 /100 | #3 | Exceptional 69.6% |
| Yakama | 100.0 /100 | #4 | Exceptional 69.3% |
| Yuman | 100.0 /100 | #5 | Exceptional 69.3% |
| Immigrants | Mexico | 100.0 /100 | #6 | Exceptional 69.1% |
| Mexicans | 100.0 /100 | #7 | Exceptional 69.0% |
| Immigrants | Fiji | 100.0 /100 | #8 | Exceptional 68.8% |
| Native Hawaiians | 100.0 /100 | #9 | Exceptional 68.4% |
| Immigrants | Philippines | 100.0 /100 | #10 | Exceptional 68.3% |
| Immigrants | Central America | 100.0 /100 | #11 | Exceptional 68.3% |
| Koreans | 100.0 /100 | #12 | Exceptional 68.3% |
| Pueblo | 100.0 /100 | #13 | Exceptional 68.2% |
| Immigrants | Cuba | 100.0 /100 | #14 | Exceptional 68.2% |
| Assyrians/Chaldeans/Syriacs | 100.0 /100 | #15 | Exceptional 68.2% |
| Immigrants | Vietnam | 100.0 /100 | #16 | Exceptional 68.2% |