Tohono O'odham vs Immigrants from Lithuania Family Households
COMPARE
Tohono O'odham
Immigrants from Lithuania
Family Households
Family Households Comparison
Tohono O'odham
Immigrants from Lithuania
67.1%
FAMILY HOUSEHOLDS
100.0/ 100
METRIC RATING
35th/ 347
METRIC RANK
63.9%
FAMILY HOUSEHOLDS
12.1/ 100
METRIC RATING
206th/ 347
METRIC RANK
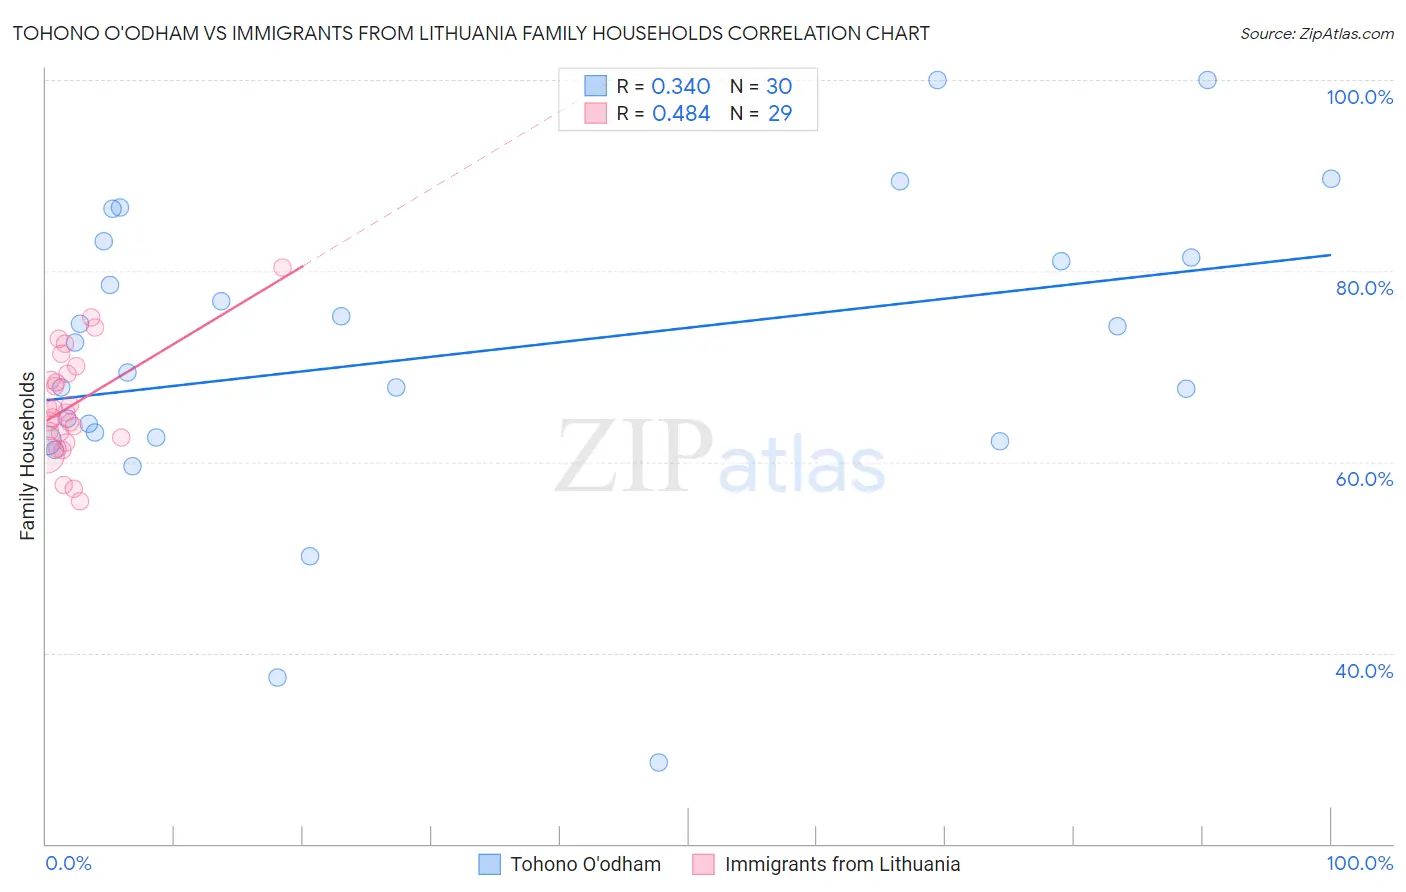
Tohono O'odham vs Immigrants from Lithuania Family Households Correlation Chart
The statistical analysis conducted on geographies consisting of 58,718,905 people shows a mild positive correlation between the proportion of Tohono O'odham and percentage of family households in the United States with a correlation coefficient (R) of 0.340 and weighted average of 67.1%. Similarly, the statistical analysis conducted on geographies consisting of 117,713,482 people shows a moderate positive correlation between the proportion of Immigrants from Lithuania and percentage of family households in the United States with a correlation coefficient (R) of 0.484 and weighted average of 63.9%, a difference of 5.1%.
Family Households Correlation Summary
| Measurement | Tohono O'odham | Immigrants from Lithuania |
| Minimum | 28.6% | 55.9% |
| Maximum | 100.0% | 80.4% |
| Range | 71.4% | 24.4% |
| Mean | 71.3% | 66.0% |
| Median | 71.0% | 65.2% |
| Interquartile 25% (IQ1) | 62.6% | 62.3% |
| Interquartile 75% (IQ3) | 81.4% | 69.6% |
| Interquartile Range (IQR) | 18.8% | 7.4% |
| Standard Deviation (Sample) | 15.9% | 5.7% |
| Standard Deviation (Population) | 15.7% | 5.6% |
Similar Demographics by Family Households
Demographics Similar to Tohono O'odham by Family Households
In terms of family households, the demographic groups most similar to Tohono O'odham are Peruvian (67.1%, a difference of 0.010%), Salvadoran (67.2%, a difference of 0.050%), Thai (67.2%, a difference of 0.050%), Tsimshian (67.1%, a difference of 0.080%), and Nepalese (67.2%, a difference of 0.090%).
| Demographics | Rating | Rank | Family Households |
| Hawaiians | 100.0 /100 | #28 | Exceptional 67.4% |
| Nicaraguans | 100.0 /100 | #29 | Exceptional 67.4% |
| Immigrants | Peru | 100.0 /100 | #30 | Exceptional 67.2% |
| Immigrants | Latin America | 100.0 /100 | #31 | Exceptional 67.2% |
| Nepalese | 100.0 /100 | #32 | Exceptional 67.2% |
| Salvadorans | 100.0 /100 | #33 | Exceptional 67.2% |
| Thais | 100.0 /100 | #34 | Exceptional 67.2% |
| Tohono O'odham | 100.0 /100 | #35 | Exceptional 67.1% |
| Peruvians | 100.0 /100 | #36 | Exceptional 67.1% |
| Tsimshian | 100.0 /100 | #37 | Exceptional 67.1% |
| Mexican American Indians | 100.0 /100 | #38 | Exceptional 67.0% |
| Immigrants | El Salvador | 100.0 /100 | #39 | Exceptional 67.0% |
| Guamanians/Chamorros | 100.0 /100 | #40 | Exceptional 66.6% |
| Immigrants | Bolivia | 100.0 /100 | #41 | Exceptional 66.6% |
| Menominee | 100.0 /100 | #42 | Exceptional 66.5% |
Demographics Similar to Immigrants from Lithuania by Family Households
In terms of family households, the demographic groups most similar to Immigrants from Lithuania are Brazilian (63.9%, a difference of 0.010%), Immigrants from Uruguay (63.9%, a difference of 0.020%), Nigerian (63.9%, a difference of 0.020%), Immigrants from Bangladesh (63.9%, a difference of 0.020%), and Norwegian (63.9%, a difference of 0.030%).
| Demographics | Rating | Rank | Family Households |
| Slavs | 18.6 /100 | #199 | Poor 64.0% |
| Immigrants | Malaysia | 17.9 /100 | #200 | Poor 64.0% |
| Immigrants | Eastern Europe | 17.2 /100 | #201 | Poor 64.0% |
| Iranians | 13.5 /100 | #202 | Poor 63.9% |
| Norwegians | 13.2 /100 | #203 | Poor 63.9% |
| Immigrants | Uruguay | 12.8 /100 | #204 | Poor 63.9% |
| Brazilians | 12.4 /100 | #205 | Poor 63.9% |
| Immigrants | Lithuania | 12.1 /100 | #206 | Poor 63.9% |
| Nigerians | 11.5 /100 | #207 | Poor 63.9% |
| Immigrants | Bangladesh | 11.4 /100 | #208 | Poor 63.9% |
| Sierra Leoneans | 11.2 /100 | #209 | Poor 63.9% |
| Immigrants | Thailand | 9.6 /100 | #210 | Tragic 63.8% |
| Shoshone | 9.4 /100 | #211 | Tragic 63.8% |
| Immigrants | Netherlands | 9.4 /100 | #212 | Tragic 63.8% |
| Immigrants | Northern Europe | 8.8 /100 | #213 | Tragic 63.8% |