Marshallese vs Immigrants from Lithuania Family Households
COMPARE
Marshallese
Immigrants from Lithuania
Family Households
Family Households Comparison
Marshallese
Immigrants from Lithuania
63.7%
FAMILY HOUSEHOLDS
6.9/ 100
METRIC RATING
218th/ 347
METRIC RANK
63.9%
FAMILY HOUSEHOLDS
12.1/ 100
METRIC RATING
206th/ 347
METRIC RANK
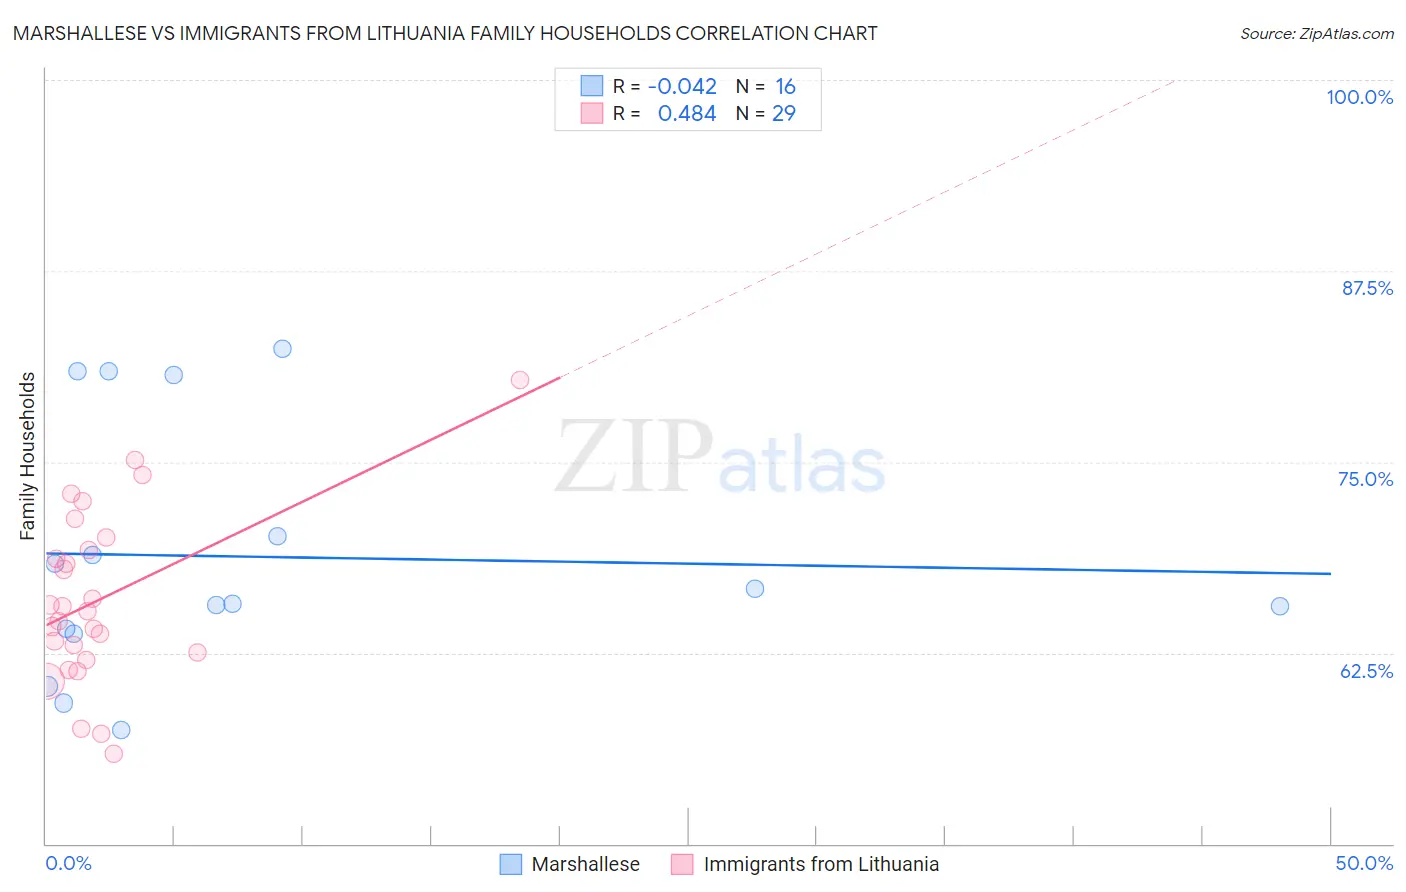
Marshallese vs Immigrants from Lithuania Family Households Correlation Chart
The statistical analysis conducted on geographies consisting of 14,761,315 people shows no correlation between the proportion of Marshallese and percentage of family households in the United States with a correlation coefficient (R) of -0.042 and weighted average of 63.7%. Similarly, the statistical analysis conducted on geographies consisting of 117,713,482 people shows a moderate positive correlation between the proportion of Immigrants from Lithuania and percentage of family households in the United States with a correlation coefficient (R) of 0.484 and weighted average of 63.9%, a difference of 0.21%.
Family Households Correlation Summary
| Measurement | Marshallese | Immigrants from Lithuania |
| Minimum | 57.4% | 55.9% |
| Maximum | 82.4% | 80.4% |
| Range | 25.0% | 24.4% |
| Mean | 68.8% | 66.0% |
| Median | 66.2% | 65.2% |
| Interquartile 25% (IQ1) | 63.9% | 62.3% |
| Interquartile 75% (IQ3) | 75.4% | 69.6% |
| Interquartile Range (IQR) | 11.5% | 7.4% |
| Standard Deviation (Sample) | 8.2% | 5.7% |
| Standard Deviation (Population) | 7.9% | 5.6% |
Demographics Similar to Marshallese and Immigrants from Lithuania by Family Households
In terms of family households, the demographic groups most similar to Marshallese are Osage (63.7%, a difference of 0.0%), Croatian (63.8%, a difference of 0.020%), Belgian (63.8%, a difference of 0.030%), Macedonian (63.7%, a difference of 0.030%), and Immigrants from Europe (63.7%, a difference of 0.030%). Similarly, the demographic groups most similar to Immigrants from Lithuania are Brazilian (63.9%, a difference of 0.010%), Immigrants from Uruguay (63.9%, a difference of 0.020%), Nigerian (63.9%, a difference of 0.020%), Immigrants from Bangladesh (63.9%, a difference of 0.020%), and Norwegian (63.9%, a difference of 0.030%).
| Demographics | Rating | Rank | Family Households |
| Iranians | 13.5 /100 | #202 | Poor 63.9% |
| Norwegians | 13.2 /100 | #203 | Poor 63.9% |
| Immigrants | Uruguay | 12.8 /100 | #204 | Poor 63.9% |
| Brazilians | 12.4 /100 | #205 | Poor 63.9% |
| Immigrants | Lithuania | 12.1 /100 | #206 | Poor 63.9% |
| Nigerians | 11.5 /100 | #207 | Poor 63.9% |
| Immigrants | Bangladesh | 11.4 /100 | #208 | Poor 63.9% |
| Sierra Leoneans | 11.2 /100 | #209 | Poor 63.9% |
| Immigrants | Thailand | 9.6 /100 | #210 | Tragic 63.8% |
| Shoshone | 9.4 /100 | #211 | Tragic 63.8% |
| Immigrants | Netherlands | 9.4 /100 | #212 | Tragic 63.8% |
| Immigrants | Northern Europe | 8.8 /100 | #213 | Tragic 63.8% |
| Celtics | 8.0 /100 | #214 | Tragic 63.8% |
| Belgians | 7.6 /100 | #215 | Tragic 63.8% |
| Croatians | 7.3 /100 | #216 | Tragic 63.8% |
| Osage | 7.0 /100 | #217 | Tragic 63.7% |
| Marshallese | 6.9 /100 | #218 | Tragic 63.7% |
| Macedonians | 6.5 /100 | #219 | Tragic 63.7% |
| Immigrants | Europe | 6.4 /100 | #220 | Tragic 63.7% |
| Immigrants | South Africa | 5.9 /100 | #221 | Tragic 63.7% |
| Immigrants | Belarus | 5.5 /100 | #222 | Tragic 63.7% |