Pima vs Immigrants from Belarus Family Households
COMPARE
Pima
Immigrants from Belarus
Family Households
Family Households Comparison
Pima
Immigrants from Belarus
65.9%
FAMILY HOUSEHOLDS
99.9/ 100
METRIC RATING
64th/ 347
METRIC RANK
63.7%
FAMILY HOUSEHOLDS
5.5/ 100
METRIC RATING
222nd/ 347
METRIC RANK
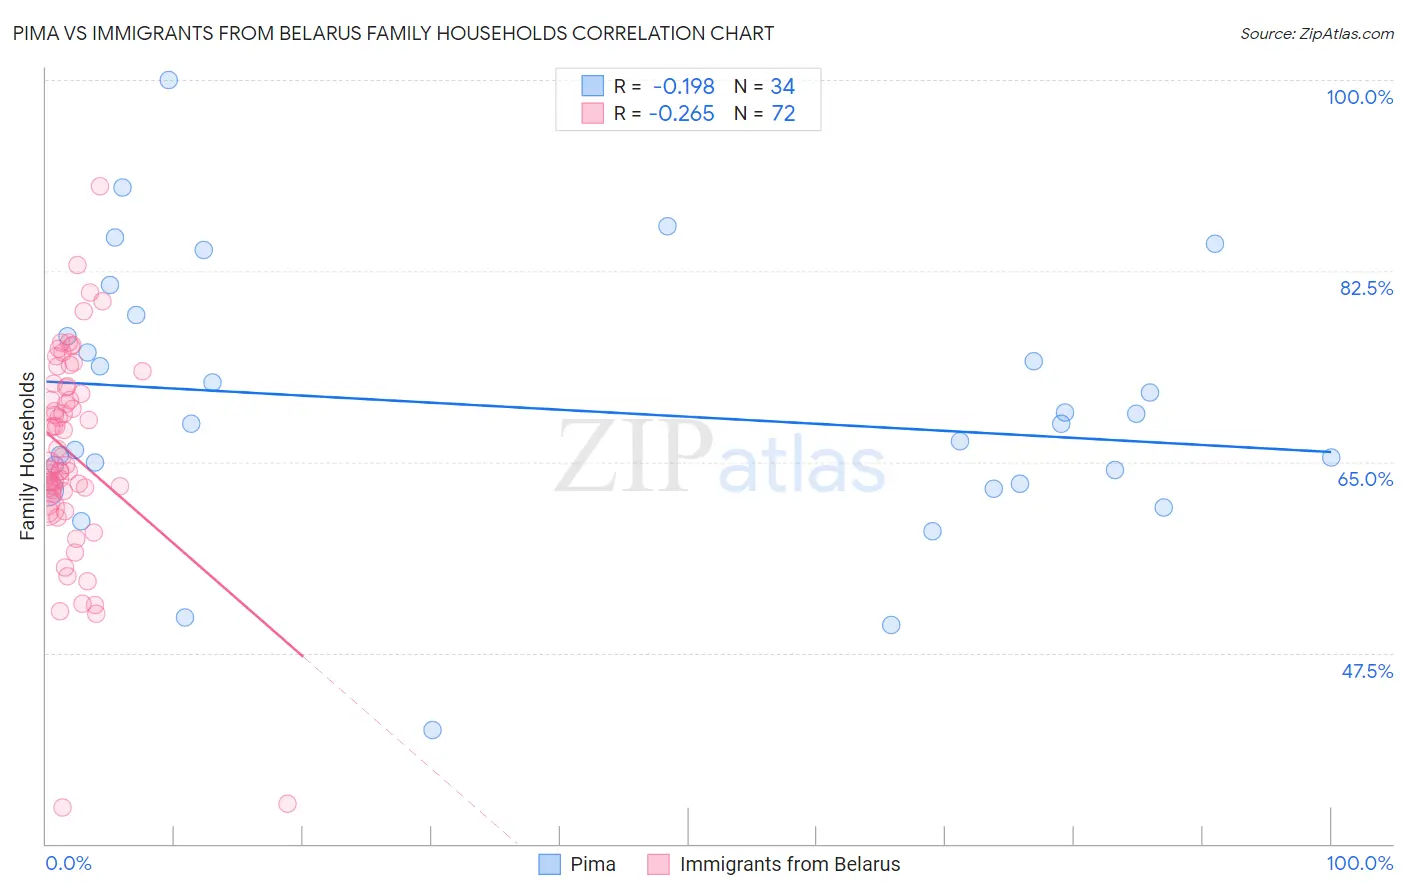
Pima vs Immigrants from Belarus Family Households Correlation Chart
The statistical analysis conducted on geographies consisting of 61,539,566 people shows a poor negative correlation between the proportion of Pima and percentage of family households in the United States with a correlation coefficient (R) of -0.198 and weighted average of 65.9%. Similarly, the statistical analysis conducted on geographies consisting of 150,177,512 people shows a weak negative correlation between the proportion of Immigrants from Belarus and percentage of family households in the United States with a correlation coefficient (R) of -0.265 and weighted average of 63.7%, a difference of 3.5%.
Family Households Correlation Summary
| Measurement | Pima | Immigrants from Belarus |
| Minimum | 40.4% | 33.4% |
| Maximum | 100.0% | 90.2% |
| Range | 59.6% | 56.9% |
| Mean | 69.9% | 65.8% |
| Median | 68.5% | 64.9% |
| Interquartile 25% (IQ1) | 63.1% | 62.2% |
| Interquartile 75% (IQ3) | 76.5% | 71.9% |
| Interquartile Range (IQR) | 13.5% | 9.7% |
| Standard Deviation (Sample) | 12.1% | 9.5% |
| Standard Deviation (Population) | 11.9% | 9.4% |
Similar Demographics by Family Households
Demographics Similar to Pima by Family Households
In terms of family households, the demographic groups most similar to Pima are Costa Rican (65.9%, a difference of 0.010%), Fijian (65.9%, a difference of 0.050%), Filipino (65.9%, a difference of 0.050%), Immigrants from Indonesia (66.0%, a difference of 0.060%), and Japanese (65.9%, a difference of 0.070%).
| Demographics | Rating | Rank | Family Households |
| Pennsylvania Germans | 100.0 /100 | #57 | Exceptional 66.1% |
| Immigrants | Asia | 100.0 /100 | #58 | Exceptional 66.1% |
| Immigrants | Korea | 100.0 /100 | #59 | Exceptional 66.0% |
| South Americans | 100.0 /100 | #60 | Exceptional 66.0% |
| Danes | 100.0 /100 | #61 | Exceptional 66.0% |
| Central Americans | 100.0 /100 | #62 | Exceptional 66.0% |
| Immigrants | Indonesia | 100.0 /100 | #63 | Exceptional 66.0% |
| Pima | 99.9 /100 | #64 | Exceptional 65.9% |
| Costa Ricans | 99.9 /100 | #65 | Exceptional 65.9% |
| Fijians | 99.9 /100 | #66 | Exceptional 65.9% |
| Filipinos | 99.9 /100 | #67 | Exceptional 65.9% |
| Japanese | 99.9 /100 | #68 | Exceptional 65.9% |
| Malaysians | 99.9 /100 | #69 | Exceptional 65.9% |
| Immigrants | Afghanistan | 99.9 /100 | #70 | Exceptional 65.9% |
| Bhutanese | 99.9 /100 | #71 | Exceptional 65.9% |
Demographics Similar to Immigrants from Belarus by Family Households
In terms of family households, the demographic groups most similar to Immigrants from Belarus are French Canadian (63.7%, a difference of 0.010%), Immigrants from South Africa (63.7%, a difference of 0.030%), Immigrants from Europe (63.7%, a difference of 0.050%), Macedonian (63.7%, a difference of 0.060%), and Turkish (63.6%, a difference of 0.070%).
| Demographics | Rating | Rank | Family Households |
| Belgians | 7.6 /100 | #215 | Tragic 63.8% |
| Croatians | 7.3 /100 | #216 | Tragic 63.8% |
| Osage | 7.0 /100 | #217 | Tragic 63.7% |
| Marshallese | 6.9 /100 | #218 | Tragic 63.7% |
| Macedonians | 6.5 /100 | #219 | Tragic 63.7% |
| Immigrants | Europe | 6.4 /100 | #220 | Tragic 63.7% |
| Immigrants | South Africa | 5.9 /100 | #221 | Tragic 63.7% |
| Immigrants | Belarus | 5.5 /100 | #222 | Tragic 63.7% |
| French Canadians | 5.4 /100 | #223 | Tragic 63.7% |
| Turks | 4.5 /100 | #224 | Tragic 63.6% |
| Immigrants | Hungary | 4.3 /100 | #225 | Tragic 63.6% |
| Immigrants | Bahamas | 4.2 /100 | #226 | Tragic 63.6% |
| Trinidadians and Tobagonians | 4.1 /100 | #227 | Tragic 63.6% |
| Blackfeet | 3.6 /100 | #228 | Tragic 63.6% |
| Bulgarians | 3.4 /100 | #229 | Tragic 63.6% |