Arab vs Immigrants from Lithuania Family Households
COMPARE
Arab
Immigrants from Lithuania
Family Households
Family Households Comparison
Arabs
Immigrants from Lithuania
64.1%
FAMILY HOUSEHOLDS
24.5/ 100
METRIC RATING
191st/ 347
METRIC RANK
63.9%
FAMILY HOUSEHOLDS
12.1/ 100
METRIC RATING
206th/ 347
METRIC RANK
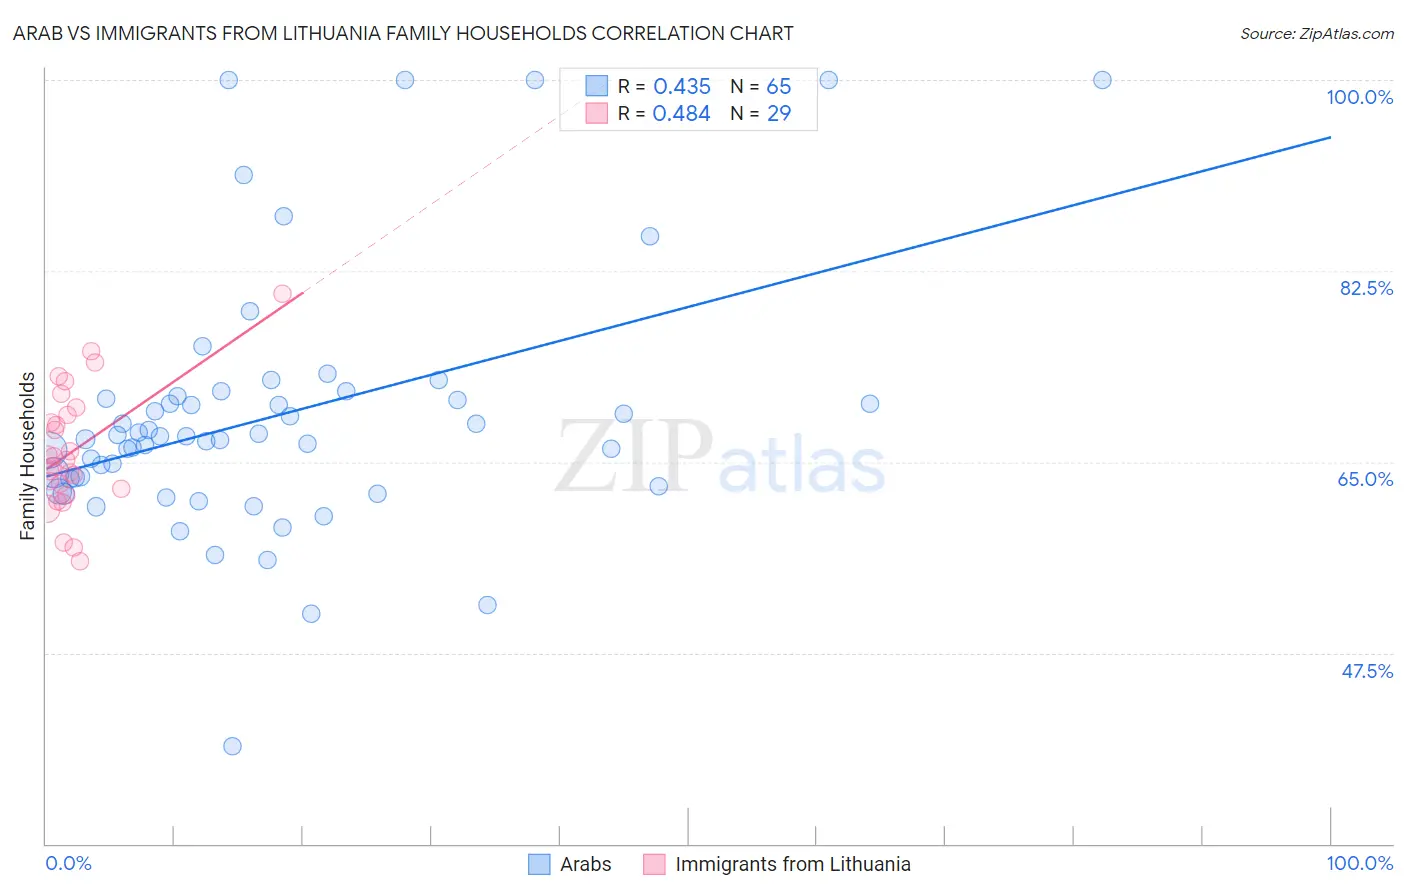
Arab vs Immigrants from Lithuania Family Households Correlation Chart
The statistical analysis conducted on geographies consisting of 486,389,490 people shows a moderate positive correlation between the proportion of Arabs and percentage of family households in the United States with a correlation coefficient (R) of 0.435 and weighted average of 64.1%. Similarly, the statistical analysis conducted on geographies consisting of 117,713,482 people shows a moderate positive correlation between the proportion of Immigrants from Lithuania and percentage of family households in the United States with a correlation coefficient (R) of 0.484 and weighted average of 63.9%, a difference of 0.29%.
Family Households Correlation Summary
| Measurement | Arab | Immigrants from Lithuania |
| Minimum | 38.9% | 55.9% |
| Maximum | 100.0% | 80.4% |
| Range | 61.1% | 24.4% |
| Mean | 69.2% | 66.0% |
| Median | 67.3% | 65.2% |
| Interquartile 25% (IQ1) | 63.1% | 62.3% |
| Interquartile 75% (IQ3) | 70.9% | 69.6% |
| Interquartile Range (IQR) | 7.8% | 7.4% |
| Standard Deviation (Sample) | 11.8% | 5.7% |
| Standard Deviation (Population) | 11.7% | 5.6% |
Demographics Similar to Arabs and Immigrants from Lithuania by Family Households
In terms of family households, the demographic groups most similar to Arabs are Zimbabwean (64.1%, a difference of 0.0%), Lithuanian (64.0%, a difference of 0.010%), French (64.0%, a difference of 0.010%), Immigrants from Western Asia (64.1%, a difference of 0.020%), and Paraguayan (64.1%, a difference of 0.040%). Similarly, the demographic groups most similar to Immigrants from Lithuania are Brazilian (63.9%, a difference of 0.010%), Immigrants from Uruguay (63.9%, a difference of 0.020%), Nigerian (63.9%, a difference of 0.020%), Immigrants from Bangladesh (63.9%, a difference of 0.020%), and Norwegian (63.9%, a difference of 0.030%).
| Demographics | Rating | Rank | Family Households |
| Paraguayans | 26.7 /100 | #188 | Fair 64.1% |
| Immigrants | Western Asia | 25.3 /100 | #189 | Fair 64.1% |
| Zimbabweans | 24.7 /100 | #190 | Fair 64.1% |
| Arabs | 24.5 /100 | #191 | Fair 64.1% |
| Lithuanians | 23.8 /100 | #192 | Fair 64.0% |
| French | 23.7 /100 | #193 | Fair 64.0% |
| Paiute | 22.2 /100 | #194 | Fair 64.0% |
| Immigrants | North America | 20.0 /100 | #195 | Poor 64.0% |
| Immigrants | Canada | 19.2 /100 | #196 | Poor 64.0% |
| Seminole | 18.9 /100 | #197 | Poor 64.0% |
| Poles | 18.9 /100 | #198 | Poor 64.0% |
| Slavs | 18.6 /100 | #199 | Poor 64.0% |
| Immigrants | Malaysia | 17.9 /100 | #200 | Poor 64.0% |
| Immigrants | Eastern Europe | 17.2 /100 | #201 | Poor 64.0% |
| Iranians | 13.5 /100 | #202 | Poor 63.9% |
| Norwegians | 13.2 /100 | #203 | Poor 63.9% |
| Immigrants | Uruguay | 12.8 /100 | #204 | Poor 63.9% |
| Brazilians | 12.4 /100 | #205 | Poor 63.9% |
| Immigrants | Lithuania | 12.1 /100 | #206 | Poor 63.9% |
| Nigerians | 11.5 /100 | #207 | Poor 63.9% |
| Immigrants | Bangladesh | 11.4 /100 | #208 | Poor 63.9% |