Peruvian vs Immigrants from Nepal Currently Married
COMPARE
Peruvian
Immigrants from Nepal
Currently Married
Currently Married Comparison
Peruvians
Immigrants from Nepal
46.6%
CURRENTLY MARRIED
50.0/ 100
METRIC RATING
174th/ 347
METRIC RANK
46.1%
CURRENTLY MARRIED
23.7/ 100
METRIC RATING
195th/ 347
METRIC RANK
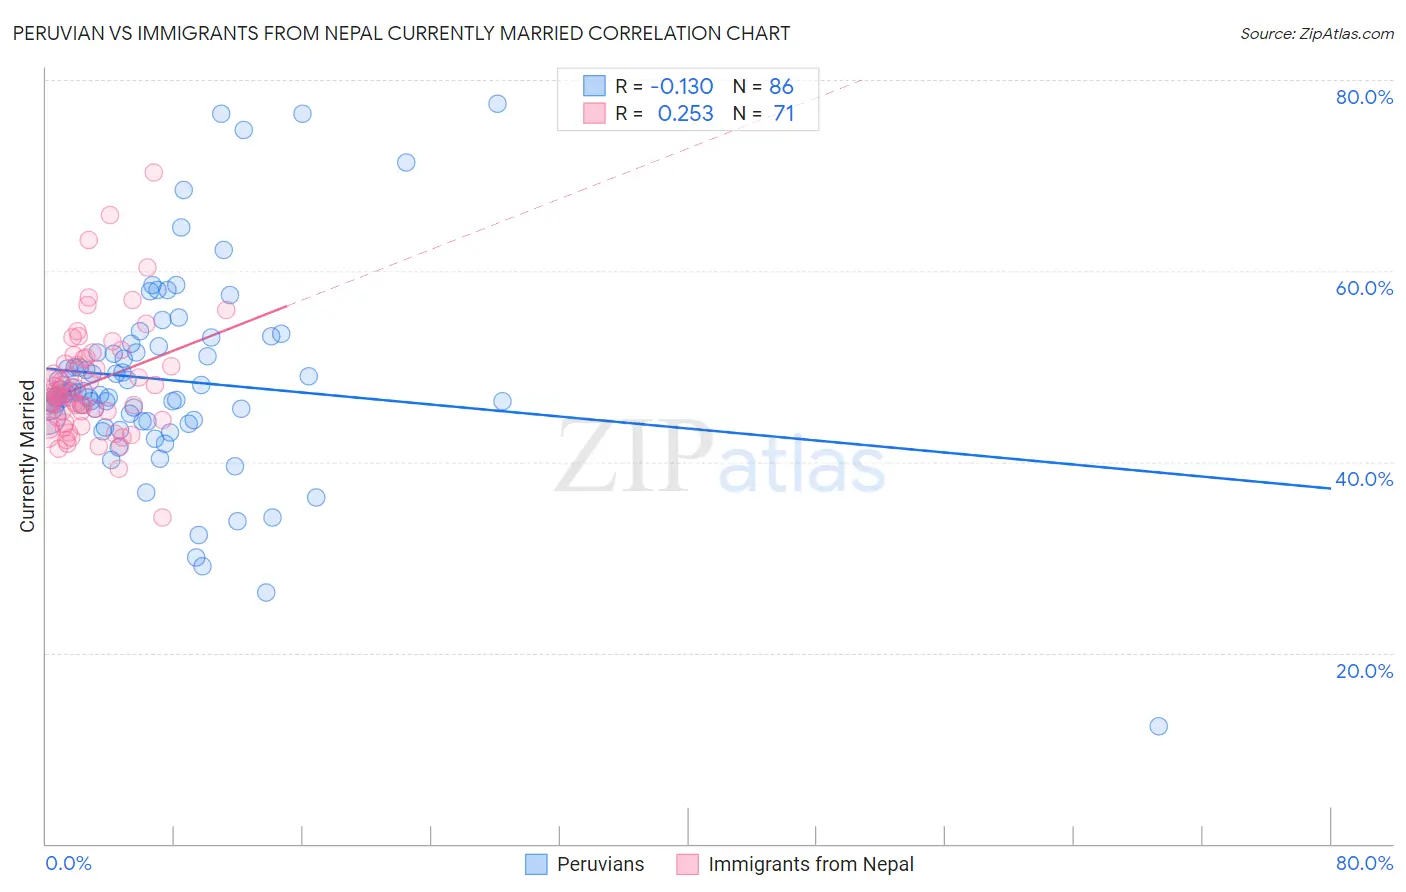
Peruvian vs Immigrants from Nepal Currently Married Correlation Chart
The statistical analysis conducted on geographies consisting of 363,210,546 people shows a poor negative correlation between the proportion of Peruvians and percentage of population currently married in the United States with a correlation coefficient (R) of -0.130 and weighted average of 46.6%. Similarly, the statistical analysis conducted on geographies consisting of 186,760,153 people shows a weak positive correlation between the proportion of Immigrants from Nepal and percentage of population currently married in the United States with a correlation coefficient (R) of 0.253 and weighted average of 46.1%, a difference of 1.1%.
Currently Married Correlation Summary
| Measurement | Peruvian | Immigrants from Nepal |
| Minimum | 12.3% | 34.2% |
| Maximum | 77.5% | 70.3% |
| Range | 65.2% | 36.1% |
| Mean | 48.5% | 48.2% |
| Median | 47.3% | 47.1% |
| Interquartile 25% (IQ1) | 44.3% | 44.4% |
| Interquartile 75% (IQ3) | 52.1% | 50.8% |
| Interquartile Range (IQR) | 7.9% | 6.4% |
| Standard Deviation (Sample) | 10.5% | 6.0% |
| Standard Deviation (Population) | 10.4% | 5.9% |
Similar Demographics by Currently Married
Demographics Similar to Peruvians by Currently Married
In terms of currently married, the demographic groups most similar to Peruvians are Immigrants from Brazil (46.6%, a difference of 0.010%), Tlingit-Haida (46.7%, a difference of 0.040%), Hawaiian (46.6%, a difference of 0.050%), Israeli (46.6%, a difference of 0.050%), and Aleut (46.7%, a difference of 0.070%).
| Demographics | Rating | Rank | Currently Married |
| Spaniards | 58.8 /100 | #167 | Average 46.8% |
| Immigrants | Afghanistan | 58.2 /100 | #168 | Average 46.8% |
| Armenians | 58.2 /100 | #169 | Average 46.8% |
| Immigrants | Latvia | 56.7 /100 | #170 | Average 46.7% |
| Immigrants | Zimbabwe | 52.4 /100 | #171 | Average 46.7% |
| Aleuts | 52.0 /100 | #172 | Average 46.7% |
| Tlingit-Haida | 51.2 /100 | #173 | Average 46.7% |
| Peruvians | 50.0 /100 | #174 | Average 46.6% |
| Immigrants | Brazil | 49.9 /100 | #175 | Average 46.6% |
| Hawaiians | 48.6 /100 | #176 | Average 46.6% |
| Israelis | 48.6 /100 | #177 | Average 46.6% |
| Chickasaw | 47.8 /100 | #178 | Average 46.6% |
| Immigrants | Oceania | 44.6 /100 | #179 | Average 46.5% |
| Costa Ricans | 43.7 /100 | #180 | Average 46.5% |
| Ottawa | 43.0 /100 | #181 | Average 46.5% |
Demographics Similar to Immigrants from Nepal by Currently Married
In terms of currently married, the demographic groups most similar to Immigrants from Nepal are South American (46.1%, a difference of 0.010%), Immigrants from Fiji (46.2%, a difference of 0.070%), Immigrants from Bosnia and Herzegovina (46.1%, a difference of 0.070%), Soviet Union (46.2%, a difference of 0.10%), and Immigrants from Kuwait (46.1%, a difference of 0.10%).
| Demographics | Rating | Rank | Currently Married |
| Colombians | 31.8 /100 | #188 | Fair 46.3% |
| Fijians | 30.3 /100 | #189 | Fair 46.3% |
| Choctaw | 29.1 /100 | #190 | Fair 46.3% |
| Immigrants | France | 27.7 /100 | #191 | Fair 46.2% |
| Soviet Union | 25.7 /100 | #192 | Fair 46.2% |
| Immigrants | Fiji | 25.0 /100 | #193 | Fair 46.2% |
| South Americans | 23.8 /100 | #194 | Fair 46.1% |
| Immigrants | Nepal | 23.7 /100 | #195 | Fair 46.1% |
| Immigrants | Bosnia and Herzegovina | 22.2 /100 | #196 | Fair 46.1% |
| Immigrants | Kuwait | 21.7 /100 | #197 | Fair 46.1% |
| Immigrants | Colombia | 21.0 /100 | #198 | Fair 46.1% |
| Immigrants | Costa Rica | 19.6 /100 | #199 | Poor 46.0% |
| Creek | 17.2 /100 | #200 | Poor 46.0% |
| Malaysians | 15.3 /100 | #201 | Poor 45.9% |
| Immigrants | Albania | 14.5 /100 | #202 | Poor 45.9% |