Immigrants from France vs Immigrants from Nepal Currently Married
COMPARE
Immigrants from France
Immigrants from Nepal
Currently Married
Currently Married Comparison
Immigrants from France
Immigrants from Nepal
46.2%
CURRENTLY MARRIED
27.7/ 100
METRIC RATING
191st/ 347
METRIC RANK
46.1%
CURRENTLY MARRIED
23.7/ 100
METRIC RATING
195th/ 347
METRIC RANK
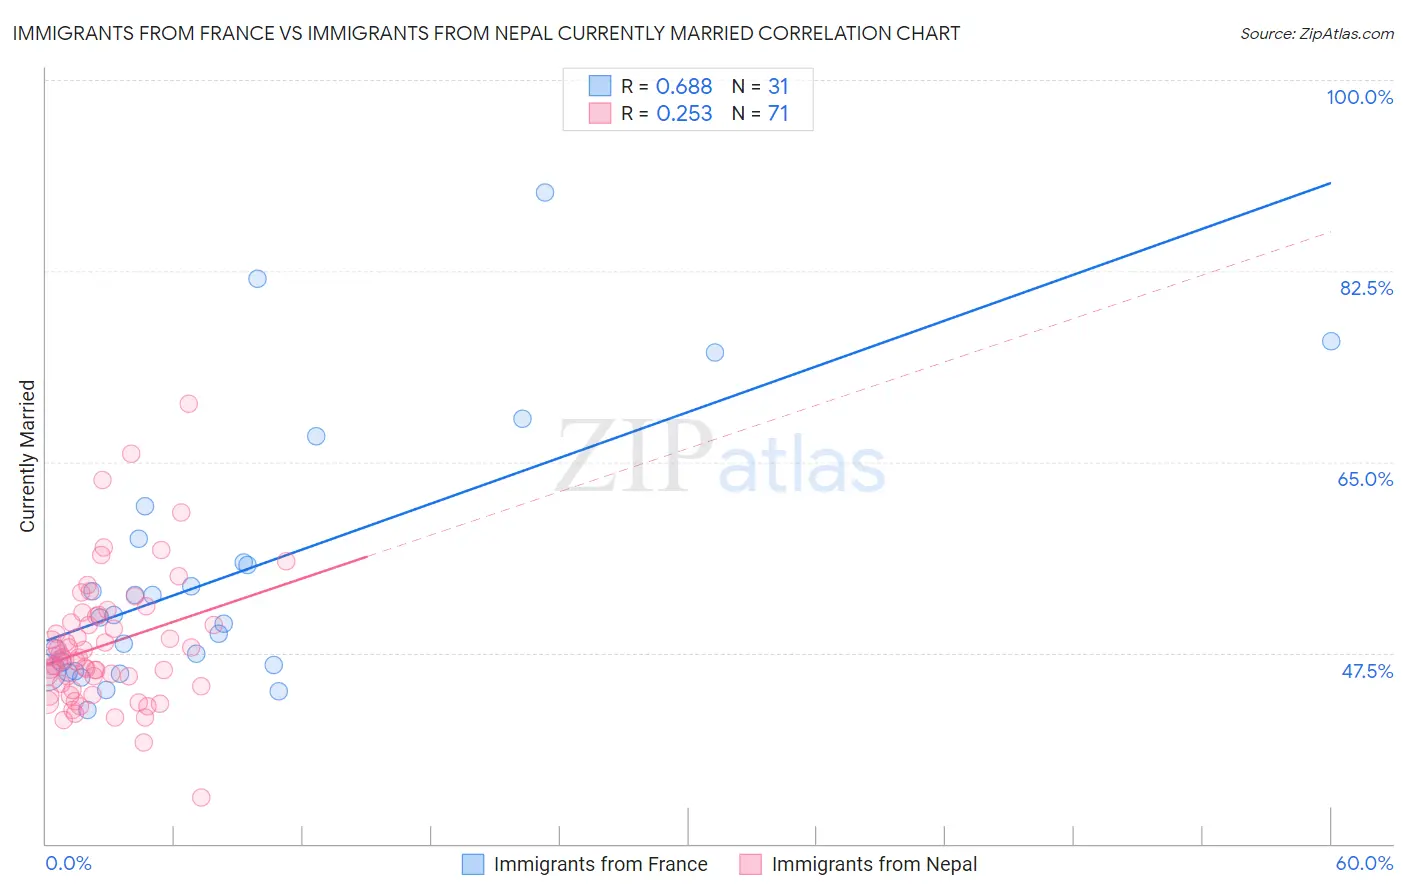
Immigrants from France vs Immigrants from Nepal Currently Married Correlation Chart
The statistical analysis conducted on geographies consisting of 287,900,584 people shows a significant positive correlation between the proportion of Immigrants from France and percentage of population currently married in the United States with a correlation coefficient (R) of 0.688 and weighted average of 46.2%. Similarly, the statistical analysis conducted on geographies consisting of 186,760,153 people shows a weak positive correlation between the proportion of Immigrants from Nepal and percentage of population currently married in the United States with a correlation coefficient (R) of 0.253 and weighted average of 46.1%, a difference of 0.20%.
Currently Married Correlation Summary
| Measurement | Immigrants from France | Immigrants from Nepal |
| Minimum | 42.2% | 34.2% |
| Maximum | 89.7% | 70.3% |
| Range | 47.5% | 36.1% |
| Mean | 54.8% | 48.2% |
| Median | 50.8% | 47.1% |
| Interquartile 25% (IQ1) | 45.8% | 44.4% |
| Interquartile 75% (IQ3) | 57.9% | 50.8% |
| Interquartile Range (IQR) | 12.1% | 6.4% |
| Standard Deviation (Sample) | 12.1% | 6.0% |
| Standard Deviation (Population) | 11.9% | 5.9% |
Demographics Similar to Immigrants from France and Immigrants from Nepal by Currently Married
In terms of currently married, the demographic groups most similar to Immigrants from France are Choctaw (46.3%, a difference of 0.060%), Soviet Union (46.2%, a difference of 0.090%), Fijian (46.3%, a difference of 0.12%), Immigrants from Fiji (46.2%, a difference of 0.13%), and Colombian (46.3%, a difference of 0.18%). Similarly, the demographic groups most similar to Immigrants from Nepal are South American (46.1%, a difference of 0.010%), Immigrants from Fiji (46.2%, a difference of 0.070%), Immigrants from Bosnia and Herzegovina (46.1%, a difference of 0.070%), Soviet Union (46.2%, a difference of 0.10%), and Immigrants from Kuwait (46.1%, a difference of 0.10%).
| Demographics | Rating | Rank | Currently Married |
| Immigrants | Northern Africa | 39.7 /100 | #183 | Fair 46.5% |
| Brazilians | 39.3 /100 | #184 | Fair 46.4% |
| Mongolians | 37.6 /100 | #185 | Fair 46.4% |
| Immigrants | Chile | 36.8 /100 | #186 | Fair 46.4% |
| Immigrants | Peru | 35.3 /100 | #187 | Fair 46.4% |
| Colombians | 31.8 /100 | #188 | Fair 46.3% |
| Fijians | 30.3 /100 | #189 | Fair 46.3% |
| Choctaw | 29.1 /100 | #190 | Fair 46.3% |
| Immigrants | France | 27.7 /100 | #191 | Fair 46.2% |
| Soviet Union | 25.7 /100 | #192 | Fair 46.2% |
| Immigrants | Fiji | 25.0 /100 | #193 | Fair 46.2% |
| South Americans | 23.8 /100 | #194 | Fair 46.1% |
| Immigrants | Nepal | 23.7 /100 | #195 | Fair 46.1% |
| Immigrants | Bosnia and Herzegovina | 22.2 /100 | #196 | Fair 46.1% |
| Immigrants | Kuwait | 21.7 /100 | #197 | Fair 46.1% |
| Immigrants | Colombia | 21.0 /100 | #198 | Fair 46.1% |
| Immigrants | Costa Rica | 19.6 /100 | #199 | Poor 46.0% |
| Creek | 17.2 /100 | #200 | Poor 46.0% |
| Malaysians | 15.3 /100 | #201 | Poor 45.9% |
| Immigrants | Albania | 14.5 /100 | #202 | Poor 45.9% |
| Taiwanese | 11.7 /100 | #203 | Poor 45.8% |