Native/Alaskan vs Immigrants from Nepal Currently Married
COMPARE
Native/Alaskan
Immigrants from Nepal
Currently Married
Currently Married Comparison
Natives/Alaskans
Immigrants from Nepal
42.8%
CURRENTLY MARRIED
0.0/ 100
METRIC RATING
288th/ 347
METRIC RANK
46.1%
CURRENTLY MARRIED
23.7/ 100
METRIC RATING
195th/ 347
METRIC RANK
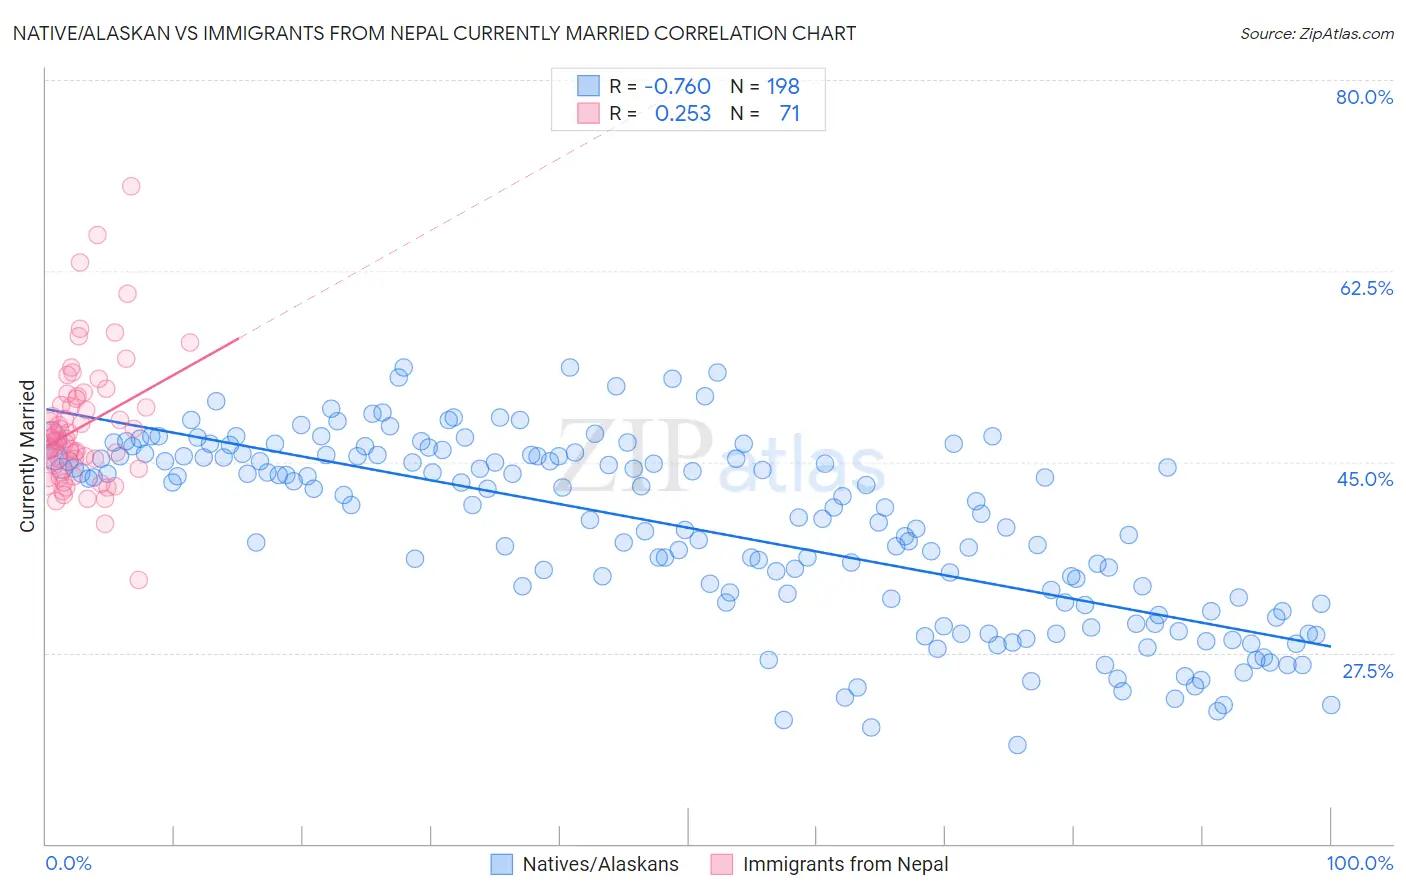
Native/Alaskan vs Immigrants from Nepal Currently Married Correlation Chart
The statistical analysis conducted on geographies consisting of 512,977,387 people shows a strong negative correlation between the proportion of Natives/Alaskans and percentage of population currently married in the United States with a correlation coefficient (R) of -0.760 and weighted average of 42.8%. Similarly, the statistical analysis conducted on geographies consisting of 186,760,153 people shows a weak positive correlation between the proportion of Immigrants from Nepal and percentage of population currently married in the United States with a correlation coefficient (R) of 0.253 and weighted average of 46.1%, a difference of 7.8%.
Currently Married Correlation Summary
| Measurement | Native/Alaskan | Immigrants from Nepal |
| Minimum | 19.1% | 34.2% |
| Maximum | 53.7% | 70.3% |
| Range | 34.6% | 36.1% |
| Mean | 38.9% | 48.2% |
| Median | 41.0% | 47.1% |
| Interquartile 25% (IQ1) | 32.1% | 44.4% |
| Interquartile 75% (IQ3) | 45.5% | 50.8% |
| Interquartile Range (IQR) | 13.5% | 6.4% |
| Standard Deviation (Sample) | 8.3% | 6.0% |
| Standard Deviation (Population) | 8.3% | 5.9% |
Similar Demographics by Currently Married
Demographics Similar to Natives/Alaskans by Currently Married
In terms of currently married, the demographic groups most similar to Natives/Alaskans are Paiute (42.7%, a difference of 0.23%), Immigrants from Ghana (42.7%, a difference of 0.24%), Guatemalan (42.9%, a difference of 0.27%), Ghanaian (42.9%, a difference of 0.29%), and Immigrants from Guatemala (42.6%, a difference of 0.36%).
| Demographics | Rating | Rank | Currently Married |
| Chippewa | 0.0 /100 | #281 | Tragic 43.2% |
| Immigrants | Ecuador | 0.0 /100 | #282 | Tragic 43.2% |
| Kiowa | 0.0 /100 | #283 | Tragic 43.2% |
| Immigrants | El Salvador | 0.0 /100 | #284 | Tragic 43.1% |
| Immigrants | Middle Africa | 0.0 /100 | #285 | Tragic 43.0% |
| Ghanaians | 0.0 /100 | #286 | Tragic 42.9% |
| Guatemalans | 0.0 /100 | #287 | Tragic 42.9% |
| Natives/Alaskans | 0.0 /100 | #288 | Tragic 42.8% |
| Paiute | 0.0 /100 | #289 | Tragic 42.7% |
| Immigrants | Ghana | 0.0 /100 | #290 | Tragic 42.7% |
| Immigrants | Guatemala | 0.0 /100 | #291 | Tragic 42.6% |
| Sub-Saharan Africans | 0.0 /100 | #292 | Tragic 42.6% |
| Yuman | 0.0 /100 | #293 | Tragic 42.6% |
| Hondurans | 0.0 /100 | #294 | Tragic 42.5% |
| Immigrants | Western Africa | 0.0 /100 | #295 | Tragic 42.4% |
Demographics Similar to Immigrants from Nepal by Currently Married
In terms of currently married, the demographic groups most similar to Immigrants from Nepal are South American (46.1%, a difference of 0.010%), Immigrants from Fiji (46.2%, a difference of 0.070%), Immigrants from Bosnia and Herzegovina (46.1%, a difference of 0.070%), Soviet Union (46.2%, a difference of 0.10%), and Immigrants from Kuwait (46.1%, a difference of 0.10%).
| Demographics | Rating | Rank | Currently Married |
| Colombians | 31.8 /100 | #188 | Fair 46.3% |
| Fijians | 30.3 /100 | #189 | Fair 46.3% |
| Choctaw | 29.1 /100 | #190 | Fair 46.3% |
| Immigrants | France | 27.7 /100 | #191 | Fair 46.2% |
| Soviet Union | 25.7 /100 | #192 | Fair 46.2% |
| Immigrants | Fiji | 25.0 /100 | #193 | Fair 46.2% |
| South Americans | 23.8 /100 | #194 | Fair 46.1% |
| Immigrants | Nepal | 23.7 /100 | #195 | Fair 46.1% |
| Immigrants | Bosnia and Herzegovina | 22.2 /100 | #196 | Fair 46.1% |
| Immigrants | Kuwait | 21.7 /100 | #197 | Fair 46.1% |
| Immigrants | Colombia | 21.0 /100 | #198 | Fair 46.1% |
| Immigrants | Costa Rica | 19.6 /100 | #199 | Poor 46.0% |
| Creek | 17.2 /100 | #200 | Poor 46.0% |
| Malaysians | 15.3 /100 | #201 | Poor 45.9% |
| Immigrants | Albania | 14.5 /100 | #202 | Poor 45.9% |