Korean vs Immigrants from Nepal Currently Married
COMPARE
Korean
Immigrants from Nepal
Currently Married
Currently Married Comparison
Koreans
Immigrants from Nepal
47.9%
CURRENTLY MARRIED
95.4/ 100
METRIC RATING
92nd/ 347
METRIC RANK
46.1%
CURRENTLY MARRIED
23.7/ 100
METRIC RATING
195th/ 347
METRIC RANK
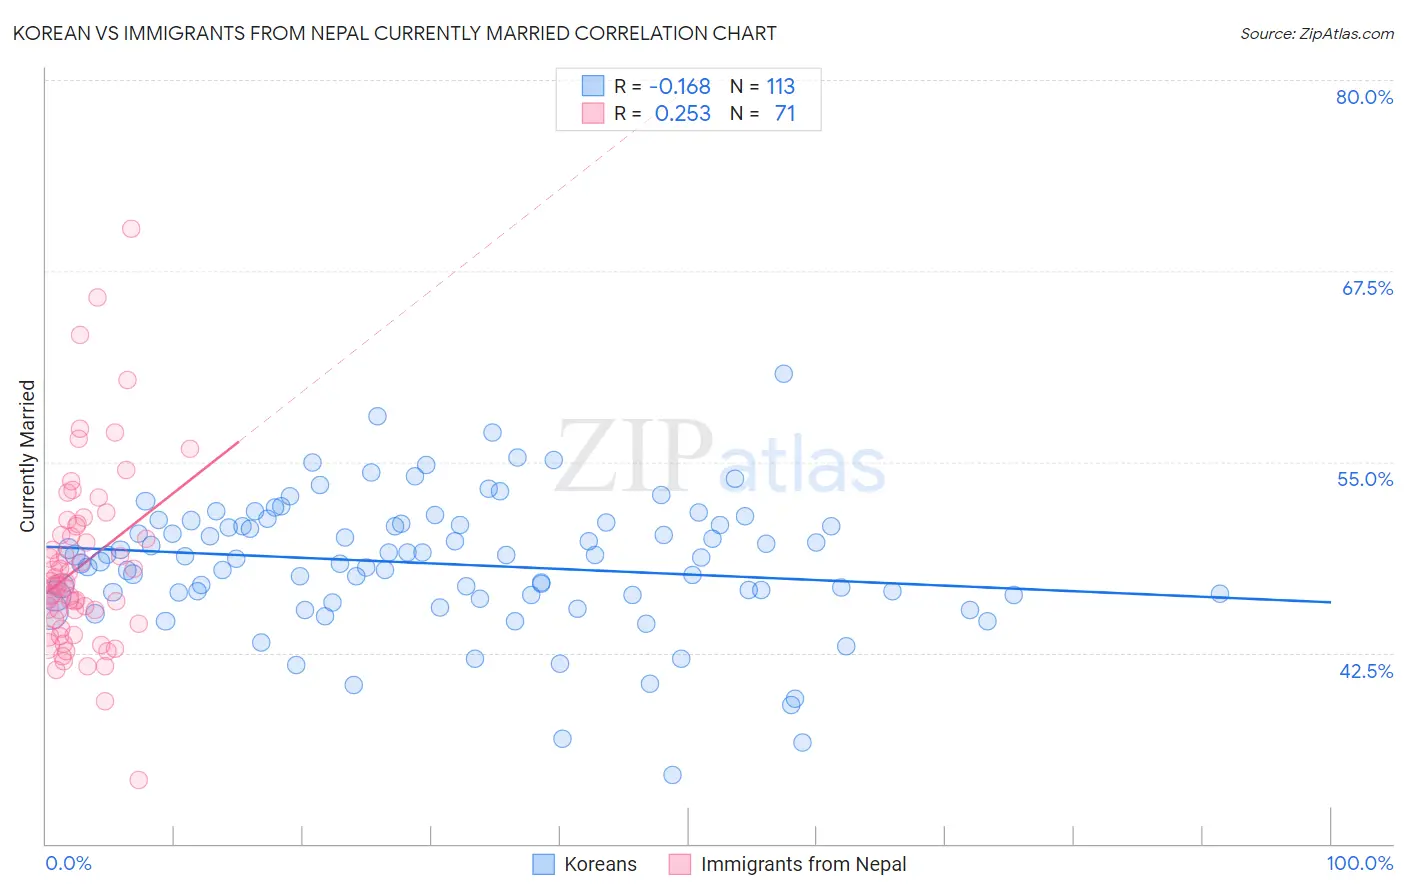
Korean vs Immigrants from Nepal Currently Married Correlation Chart
The statistical analysis conducted on geographies consisting of 510,845,444 people shows a poor negative correlation between the proportion of Koreans and percentage of population currently married in the United States with a correlation coefficient (R) of -0.168 and weighted average of 47.9%. Similarly, the statistical analysis conducted on geographies consisting of 186,760,153 people shows a weak positive correlation between the proportion of Immigrants from Nepal and percentage of population currently married in the United States with a correlation coefficient (R) of 0.253 and weighted average of 46.1%, a difference of 3.9%.
Currently Married Correlation Summary
| Measurement | Korean | Immigrants from Nepal |
| Minimum | 34.5% | 34.2% |
| Maximum | 60.8% | 70.3% |
| Range | 26.3% | 36.1% |
| Mean | 48.3% | 48.2% |
| Median | 48.7% | 47.1% |
| Interquartile 25% (IQ1) | 46.3% | 44.4% |
| Interquartile 75% (IQ3) | 50.9% | 50.8% |
| Interquartile Range (IQR) | 4.7% | 6.4% |
| Standard Deviation (Sample) | 4.3% | 6.0% |
| Standard Deviation (Population) | 4.3% | 5.9% |
Similar Demographics by Currently Married
Demographics Similar to Koreans by Currently Married
In terms of currently married, the demographic groups most similar to Koreans are Immigrants from Bolivia (47.9%, a difference of 0.040%), Lebanese (47.9%, a difference of 0.050%), American (48.0%, a difference of 0.070%), Native Hawaiian (47.9%, a difference of 0.070%), and Indian (Asian) (48.0%, a difference of 0.090%).
| Demographics | Rating | Rank | Currently Married |
| French Canadians | 96.3 /100 | #85 | Exceptional 48.0% |
| Immigrants | Japan | 96.2 /100 | #86 | Exceptional 48.0% |
| Jordanians | 96.2 /100 | #87 | Exceptional 48.0% |
| Immigrants | Eastern Europe | 96.1 /100 | #88 | Exceptional 48.0% |
| Indians (Asian) | 95.8 /100 | #89 | Exceptional 48.0% |
| Americans | 95.7 /100 | #90 | Exceptional 48.0% |
| Immigrants | Bolivia | 95.6 /100 | #91 | Exceptional 47.9% |
| Koreans | 95.4 /100 | #92 | Exceptional 47.9% |
| Lebanese | 95.1 /100 | #93 | Exceptional 47.9% |
| Native Hawaiians | 95.0 /100 | #94 | Exceptional 47.9% |
| Immigrants | Bulgaria | 94.8 /100 | #95 | Exceptional 47.9% |
| Egyptians | 94.8 /100 | #96 | Exceptional 47.9% |
| Immigrants | Ukraine | 94.8 /100 | #97 | Exceptional 47.9% |
| Immigrants | China | 94.7 /100 | #98 | Exceptional 47.9% |
| Immigrants | Sweden | 94.3 /100 | #99 | Exceptional 47.8% |
Demographics Similar to Immigrants from Nepal by Currently Married
In terms of currently married, the demographic groups most similar to Immigrants from Nepal are South American (46.1%, a difference of 0.010%), Immigrants from Fiji (46.2%, a difference of 0.070%), Immigrants from Bosnia and Herzegovina (46.1%, a difference of 0.070%), Soviet Union (46.2%, a difference of 0.10%), and Immigrants from Kuwait (46.1%, a difference of 0.10%).
| Demographics | Rating | Rank | Currently Married |
| Colombians | 31.8 /100 | #188 | Fair 46.3% |
| Fijians | 30.3 /100 | #189 | Fair 46.3% |
| Choctaw | 29.1 /100 | #190 | Fair 46.3% |
| Immigrants | France | 27.7 /100 | #191 | Fair 46.2% |
| Soviet Union | 25.7 /100 | #192 | Fair 46.2% |
| Immigrants | Fiji | 25.0 /100 | #193 | Fair 46.2% |
| South Americans | 23.8 /100 | #194 | Fair 46.1% |
| Immigrants | Nepal | 23.7 /100 | #195 | Fair 46.1% |
| Immigrants | Bosnia and Herzegovina | 22.2 /100 | #196 | Fair 46.1% |
| Immigrants | Kuwait | 21.7 /100 | #197 | Fair 46.1% |
| Immigrants | Colombia | 21.0 /100 | #198 | Fair 46.1% |
| Immigrants | Costa Rica | 19.6 /100 | #199 | Poor 46.0% |
| Creek | 17.2 /100 | #200 | Poor 46.0% |
| Malaysians | 15.3 /100 | #201 | Poor 45.9% |
| Immigrants | Albania | 14.5 /100 | #202 | Poor 45.9% |