Peruvian vs Comanche Currently Married
COMPARE
Peruvian
Comanche
Currently Married
Currently Married Comparison
Peruvians
Comanche
46.6%
CURRENTLY MARRIED
50.0/ 100
METRIC RATING
174th/ 347
METRIC RANK
45.0%
CURRENTLY MARRIED
2.1/ 100
METRIC RATING
226th/ 347
METRIC RANK
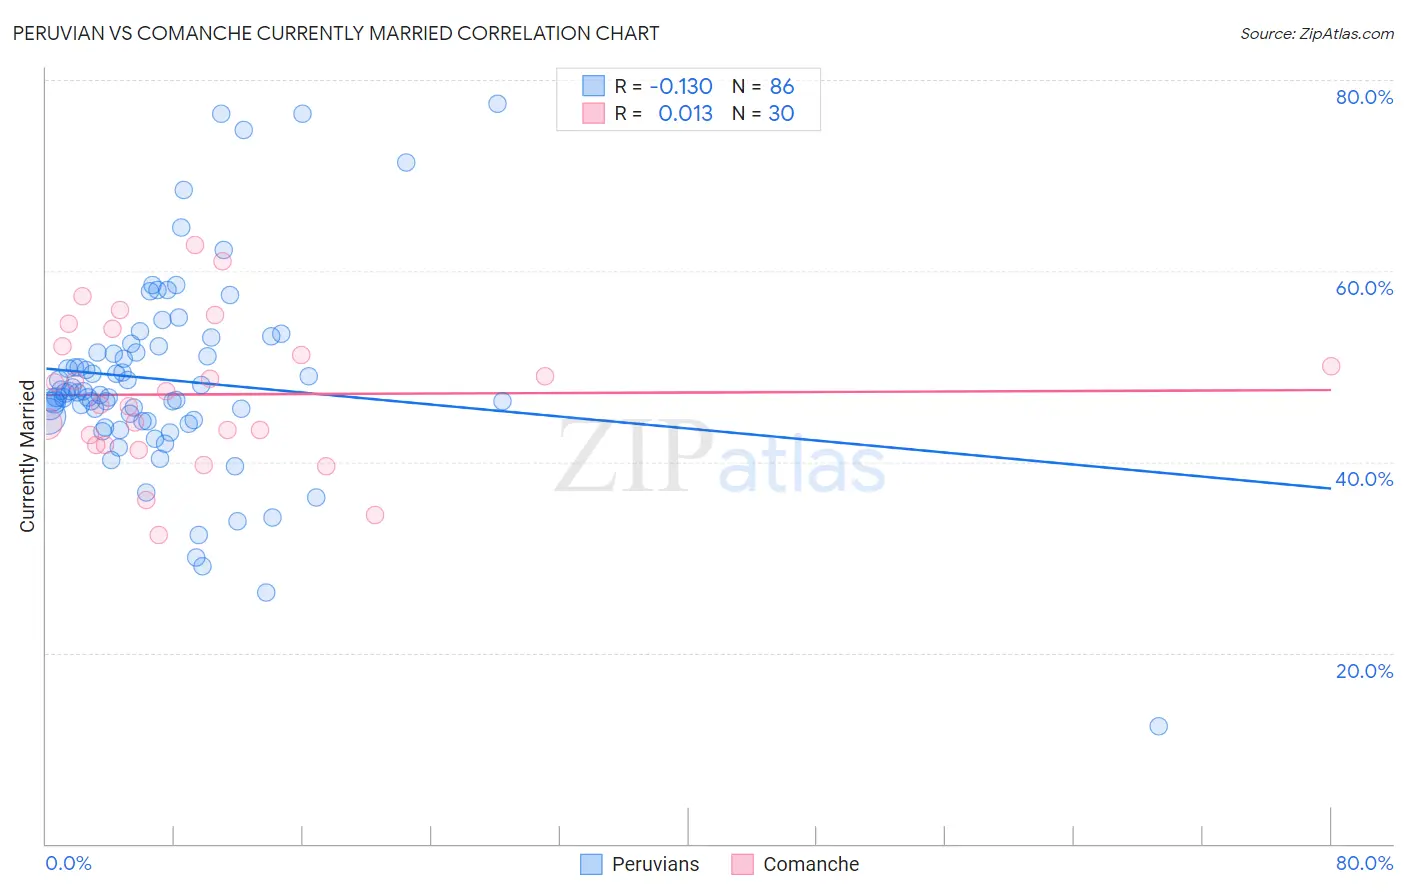
Peruvian vs Comanche Currently Married Correlation Chart
The statistical analysis conducted on geographies consisting of 363,210,546 people shows a poor negative correlation between the proportion of Peruvians and percentage of population currently married in the United States with a correlation coefficient (R) of -0.130 and weighted average of 46.6%. Similarly, the statistical analysis conducted on geographies consisting of 109,782,091 people shows no correlation between the proportion of Comanche and percentage of population currently married in the United States with a correlation coefficient (R) of 0.013 and weighted average of 45.0%, a difference of 3.7%.
Currently Married Correlation Summary
| Measurement | Peruvian | Comanche |
| Minimum | 12.3% | 32.3% |
| Maximum | 77.5% | 62.7% |
| Range | 65.2% | 30.4% |
| Mean | 48.5% | 47.1% |
| Median | 47.3% | 46.6% |
| Interquartile 25% (IQ1) | 44.3% | 41.8% |
| Interquartile 75% (IQ3) | 52.1% | 52.1% |
| Interquartile Range (IQR) | 7.9% | 10.2% |
| Standard Deviation (Sample) | 10.5% | 7.5% |
| Standard Deviation (Population) | 10.4% | 7.4% |
Similar Demographics by Currently Married
Demographics Similar to Peruvians by Currently Married
In terms of currently married, the demographic groups most similar to Peruvians are Immigrants from Brazil (46.6%, a difference of 0.010%), Tlingit-Haida (46.7%, a difference of 0.040%), Hawaiian (46.6%, a difference of 0.050%), Israeli (46.6%, a difference of 0.050%), and Aleut (46.7%, a difference of 0.070%).
| Demographics | Rating | Rank | Currently Married |
| Spaniards | 58.8 /100 | #167 | Average 46.8% |
| Immigrants | Afghanistan | 58.2 /100 | #168 | Average 46.8% |
| Armenians | 58.2 /100 | #169 | Average 46.8% |
| Immigrants | Latvia | 56.7 /100 | #170 | Average 46.7% |
| Immigrants | Zimbabwe | 52.4 /100 | #171 | Average 46.7% |
| Aleuts | 52.0 /100 | #172 | Average 46.7% |
| Tlingit-Haida | 51.2 /100 | #173 | Average 46.7% |
| Peruvians | 50.0 /100 | #174 | Average 46.6% |
| Immigrants | Brazil | 49.9 /100 | #175 | Average 46.6% |
| Hawaiians | 48.6 /100 | #176 | Average 46.6% |
| Israelis | 48.6 /100 | #177 | Average 46.6% |
| Chickasaw | 47.8 /100 | #178 | Average 46.6% |
| Immigrants | Oceania | 44.6 /100 | #179 | Average 46.5% |
| Costa Ricans | 43.7 /100 | #180 | Average 46.5% |
| Ottawa | 43.0 /100 | #181 | Average 46.5% |
Demographics Similar to Comanche by Currently Married
In terms of currently married, the demographic groups most similar to Comanche are Spanish American (45.0%, a difference of 0.0%), Immigrants from Uruguay (45.0%, a difference of 0.010%), Immigrants from Uganda (45.0%, a difference of 0.050%), French American Indian (45.0%, a difference of 0.050%), and Immigrants from Laos (45.0%, a difference of 0.10%).
| Demographics | Rating | Rank | Currently Married |
| Immigrants | Portugal | 3.5 /100 | #219 | Tragic 45.2% |
| Kenyans | 3.1 /100 | #220 | Tragic 45.2% |
| Mexicans | 3.0 /100 | #221 | Tragic 45.2% |
| Immigrants | Azores | 2.5 /100 | #222 | Tragic 45.1% |
| Immigrants | Laos | 2.3 /100 | #223 | Tragic 45.0% |
| Immigrants | Uganda | 2.2 /100 | #224 | Tragic 45.0% |
| French American Indians | 2.2 /100 | #225 | Tragic 45.0% |
| Comanche | 2.1 /100 | #226 | Tragic 45.0% |
| Spanish Americans | 2.1 /100 | #227 | Tragic 45.0% |
| Immigrants | Uruguay | 2.0 /100 | #228 | Tragic 45.0% |
| Cree | 1.7 /100 | #229 | Tragic 44.9% |
| Immigrants | Kenya | 1.6 /100 | #230 | Tragic 44.9% |
| Immigrants | Panama | 1.5 /100 | #231 | Tragic 44.9% |
| Nepalese | 1.2 /100 | #232 | Tragic 44.7% |
| Immigrants | Saudi Arabia | 1.1 /100 | #233 | Tragic 44.7% |