Cape Verdean vs Immigrants from Nepal Currently Married
COMPARE
Cape Verdean
Immigrants from Nepal
Currently Married
Currently Married Comparison
Cape Verdeans
Immigrants from Nepal
39.6%
CURRENTLY MARRIED
0.0/ 100
METRIC RATING
338th/ 347
METRIC RANK
46.1%
CURRENTLY MARRIED
23.7/ 100
METRIC RATING
195th/ 347
METRIC RANK
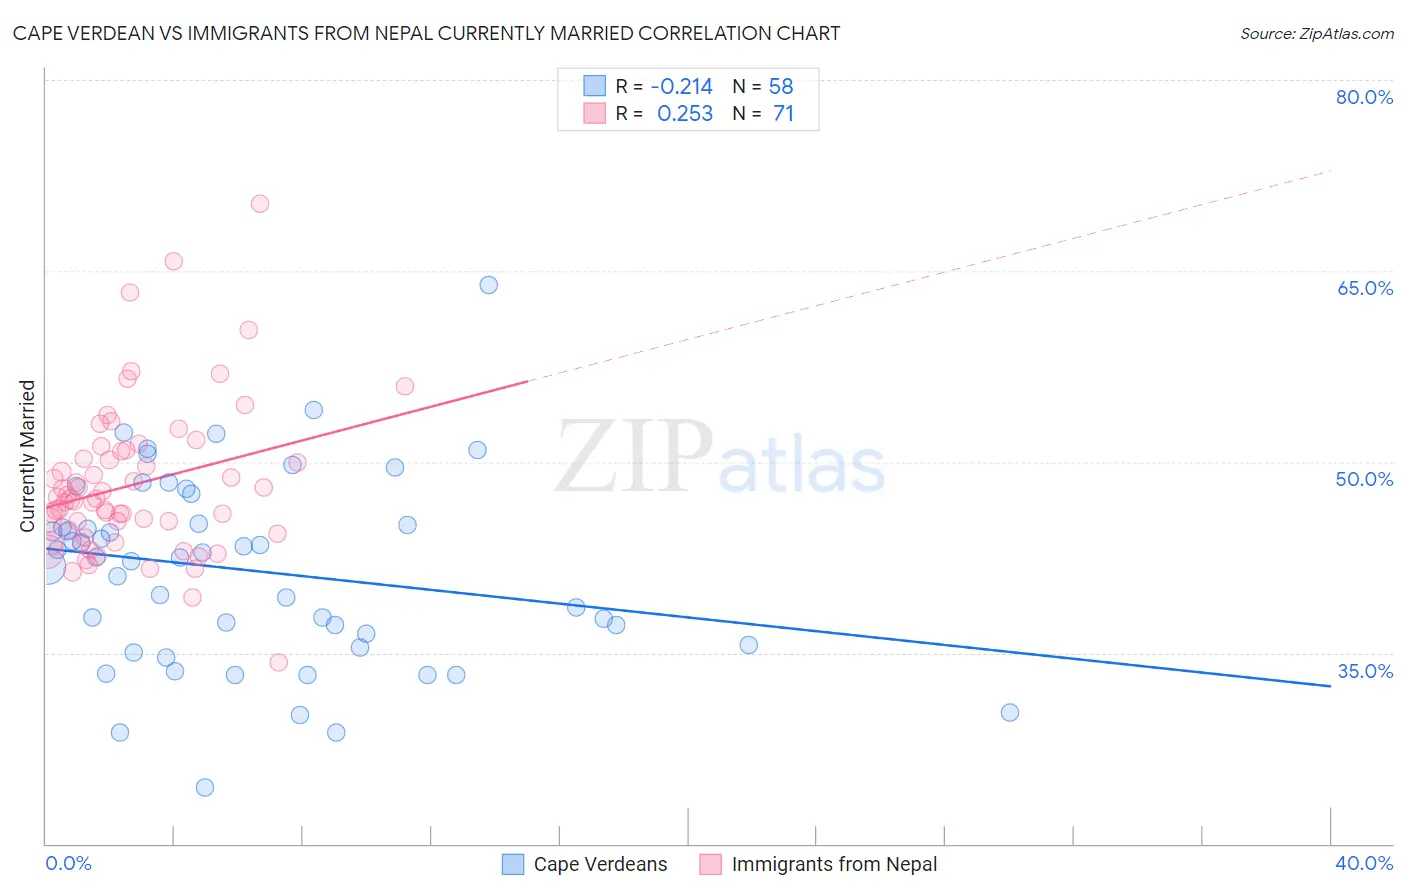
Cape Verdean vs Immigrants from Nepal Currently Married Correlation Chart
The statistical analysis conducted on geographies consisting of 107,578,938 people shows a weak negative correlation between the proportion of Cape Verdeans and percentage of population currently married in the United States with a correlation coefficient (R) of -0.214 and weighted average of 39.6%. Similarly, the statistical analysis conducted on geographies consisting of 186,760,153 people shows a weak positive correlation between the proportion of Immigrants from Nepal and percentage of population currently married in the United States with a correlation coefficient (R) of 0.253 and weighted average of 46.1%, a difference of 16.6%.
Currently Married Correlation Summary
| Measurement | Cape Verdean | Immigrants from Nepal |
| Minimum | 24.4% | 34.2% |
| Maximum | 63.9% | 70.3% |
| Range | 39.5% | 36.1% |
| Mean | 41.5% | 48.2% |
| Median | 42.5% | 47.1% |
| Interquartile 25% (IQ1) | 35.6% | 44.4% |
| Interquartile 75% (IQ3) | 45.1% | 50.8% |
| Interquartile Range (IQR) | 9.5% | 6.4% |
| Standard Deviation (Sample) | 7.5% | 6.0% |
| Standard Deviation (Population) | 7.4% | 5.9% |
Similar Demographics by Currently Married
Demographics Similar to Cape Verdeans by Currently Married
In terms of currently married, the demographic groups most similar to Cape Verdeans are Black/African American (39.6%, a difference of 0.090%), Dominican (39.5%, a difference of 0.15%), British West Indian (39.8%, a difference of 0.47%), Lumbee (39.8%, a difference of 0.65%), and Puerto Rican (39.9%, a difference of 0.81%).
| Demographics | Rating | Rank | Currently Married |
| Immigrants | Barbados | 0.0 /100 | #331 | Tragic 40.3% |
| Immigrants | St. Vincent and the Grenadines | 0.0 /100 | #332 | Tragic 40.1% |
| Yup'ik | 0.0 /100 | #333 | Tragic 39.9% |
| Puerto Ricans | 0.0 /100 | #334 | Tragic 39.9% |
| Lumbee | 0.0 /100 | #335 | Tragic 39.8% |
| British West Indians | 0.0 /100 | #336 | Tragic 39.8% |
| Blacks/African Americans | 0.0 /100 | #337 | Tragic 39.6% |
| Cape Verdeans | 0.0 /100 | #338 | Tragic 39.6% |
| Dominicans | 0.0 /100 | #339 | Tragic 39.5% |
| Immigrants | Grenada | 0.0 /100 | #340 | Tragic 39.1% |
| Navajo | 0.0 /100 | #341 | Tragic 39.0% |
| Immigrants | Dominican Republic | 0.0 /100 | #342 | Tragic 38.9% |
| Pueblo | 0.0 /100 | #343 | Tragic 38.2% |
| Immigrants | Cabo Verde | 0.0 /100 | #344 | Tragic 37.8% |
| Tohono O'odham | 0.0 /100 | #345 | Tragic 36.8% |
Demographics Similar to Immigrants from Nepal by Currently Married
In terms of currently married, the demographic groups most similar to Immigrants from Nepal are South American (46.1%, a difference of 0.010%), Immigrants from Fiji (46.2%, a difference of 0.070%), Immigrants from Bosnia and Herzegovina (46.1%, a difference of 0.070%), Soviet Union (46.2%, a difference of 0.10%), and Immigrants from Kuwait (46.1%, a difference of 0.10%).
| Demographics | Rating | Rank | Currently Married |
| Colombians | 31.8 /100 | #188 | Fair 46.3% |
| Fijians | 30.3 /100 | #189 | Fair 46.3% |
| Choctaw | 29.1 /100 | #190 | Fair 46.3% |
| Immigrants | France | 27.7 /100 | #191 | Fair 46.2% |
| Soviet Union | 25.7 /100 | #192 | Fair 46.2% |
| Immigrants | Fiji | 25.0 /100 | #193 | Fair 46.2% |
| South Americans | 23.8 /100 | #194 | Fair 46.1% |
| Immigrants | Nepal | 23.7 /100 | #195 | Fair 46.1% |
| Immigrants | Bosnia and Herzegovina | 22.2 /100 | #196 | Fair 46.1% |
| Immigrants | Kuwait | 21.7 /100 | #197 | Fair 46.1% |
| Immigrants | Colombia | 21.0 /100 | #198 | Fair 46.1% |
| Immigrants | Costa Rica | 19.6 /100 | #199 | Poor 46.0% |
| Creek | 17.2 /100 | #200 | Poor 46.0% |
| Malaysians | 15.3 /100 | #201 | Poor 45.9% |
| Immigrants | Albania | 14.5 /100 | #202 | Poor 45.9% |