Peruvian vs Immigrants Currently Married
COMPARE
Peruvian
Immigrants
Currently Married
Currently Married Comparison
Peruvians
Immigrants
46.6%
CURRENTLY MARRIED
50.0/ 100
METRIC RATING
174th/ 347
METRIC RANK
45.8%
CURRENTLY MARRIED
11.2/ 100
METRIC RATING
206th/ 347
METRIC RANK
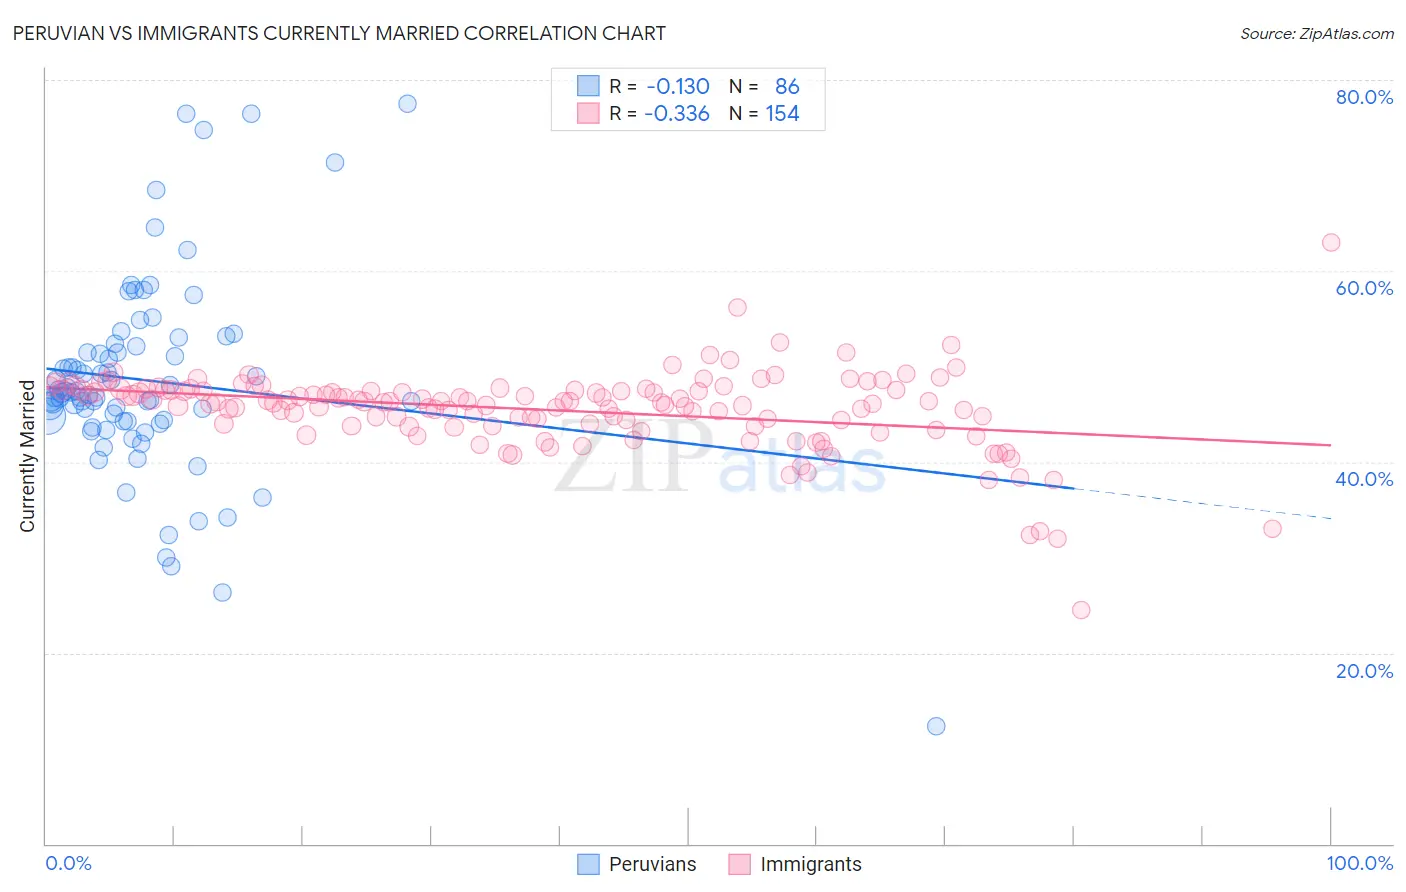
Peruvian vs Immigrants Currently Married Correlation Chart
The statistical analysis conducted on geographies consisting of 363,210,546 people shows a poor negative correlation between the proportion of Peruvians and percentage of population currently married in the United States with a correlation coefficient (R) of -0.130 and weighted average of 46.6%. Similarly, the statistical analysis conducted on geographies consisting of 577,640,121 people shows a mild negative correlation between the proportion of Immigrants and percentage of population currently married in the United States with a correlation coefficient (R) of -0.336 and weighted average of 45.8%, a difference of 1.9%.
Currently Married Correlation Summary
| Measurement | Peruvian | Immigrants |
| Minimum | 12.3% | 24.5% |
| Maximum | 77.5% | 62.9% |
| Range | 65.2% | 38.5% |
| Mean | 48.5% | 45.4% |
| Median | 47.3% | 46.3% |
| Interquartile 25% (IQ1) | 44.3% | 43.8% |
| Interquartile 75% (IQ3) | 52.1% | 47.5% |
| Interquartile Range (IQR) | 7.9% | 3.7% |
| Standard Deviation (Sample) | 10.5% | 4.2% |
| Standard Deviation (Population) | 10.4% | 4.2% |
Similar Demographics by Currently Married
Demographics Similar to Peruvians by Currently Married
In terms of currently married, the demographic groups most similar to Peruvians are Immigrants from Brazil (46.6%, a difference of 0.010%), Tlingit-Haida (46.7%, a difference of 0.040%), Hawaiian (46.6%, a difference of 0.050%), Israeli (46.6%, a difference of 0.050%), and Aleut (46.7%, a difference of 0.070%).
| Demographics | Rating | Rank | Currently Married |
| Spaniards | 58.8 /100 | #167 | Average 46.8% |
| Immigrants | Afghanistan | 58.2 /100 | #168 | Average 46.8% |
| Armenians | 58.2 /100 | #169 | Average 46.8% |
| Immigrants | Latvia | 56.7 /100 | #170 | Average 46.7% |
| Immigrants | Zimbabwe | 52.4 /100 | #171 | Average 46.7% |
| Aleuts | 52.0 /100 | #172 | Average 46.7% |
| Tlingit-Haida | 51.2 /100 | #173 | Average 46.7% |
| Peruvians | 50.0 /100 | #174 | Average 46.6% |
| Immigrants | Brazil | 49.9 /100 | #175 | Average 46.6% |
| Hawaiians | 48.6 /100 | #176 | Average 46.6% |
| Israelis | 48.6 /100 | #177 | Average 46.6% |
| Chickasaw | 47.8 /100 | #178 | Average 46.6% |
| Immigrants | Oceania | 44.6 /100 | #179 | Average 46.5% |
| Costa Ricans | 43.7 /100 | #180 | Average 46.5% |
| Ottawa | 43.0 /100 | #181 | Average 46.5% |
Demographics Similar to Immigrants by Currently Married
In terms of currently married, the demographic groups most similar to Immigrants are South American Indian (45.8%, a difference of 0.020%), Taiwanese (45.8%, a difference of 0.040%), Immigrants from Spain (45.8%, a difference of 0.040%), Immigrants from South America (45.7%, a difference of 0.040%), and Alsatian (45.7%, a difference of 0.050%).
| Demographics | Rating | Rank | Currently Married |
| Immigrants | Costa Rica | 19.6 /100 | #199 | Poor 46.0% |
| Creek | 17.2 /100 | #200 | Poor 46.0% |
| Malaysians | 15.3 /100 | #201 | Poor 45.9% |
| Immigrants | Albania | 14.5 /100 | #202 | Poor 45.9% |
| Taiwanese | 11.7 /100 | #203 | Poor 45.8% |
| Immigrants | Spain | 11.6 /100 | #204 | Poor 45.8% |
| South American Indians | 11.5 /100 | #205 | Poor 45.8% |
| Immigrants | Immigrants | 11.2 /100 | #206 | Poor 45.8% |
| Immigrants | South America | 10.8 /100 | #207 | Poor 45.7% |
| Alsatians | 10.8 /100 | #208 | Poor 45.7% |
| Immigrants | Micronesia | 8.8 /100 | #209 | Tragic 45.6% |
| Uruguayans | 7.9 /100 | #210 | Tragic 45.6% |
| Houma | 7.2 /100 | #211 | Tragic 45.5% |
| Marshallese | 7.2 /100 | #212 | Tragic 45.5% |
| Alaska Natives | 7.0 /100 | #213 | Tragic 45.5% |