Peruvian vs Immigrants from Nepal Master's Degree
COMPARE
Peruvian
Immigrants from Nepal
Master's Degree
Master's Degree Comparison
Peruvians
Immigrants from Nepal
15.3%
MASTER'S DEGREE
68.7/ 100
METRIC RATING
162nd/ 347
METRIC RANK
17.0%
MASTER'S DEGREE
98.6/ 100
METRIC RATING
101st/ 347
METRIC RANK
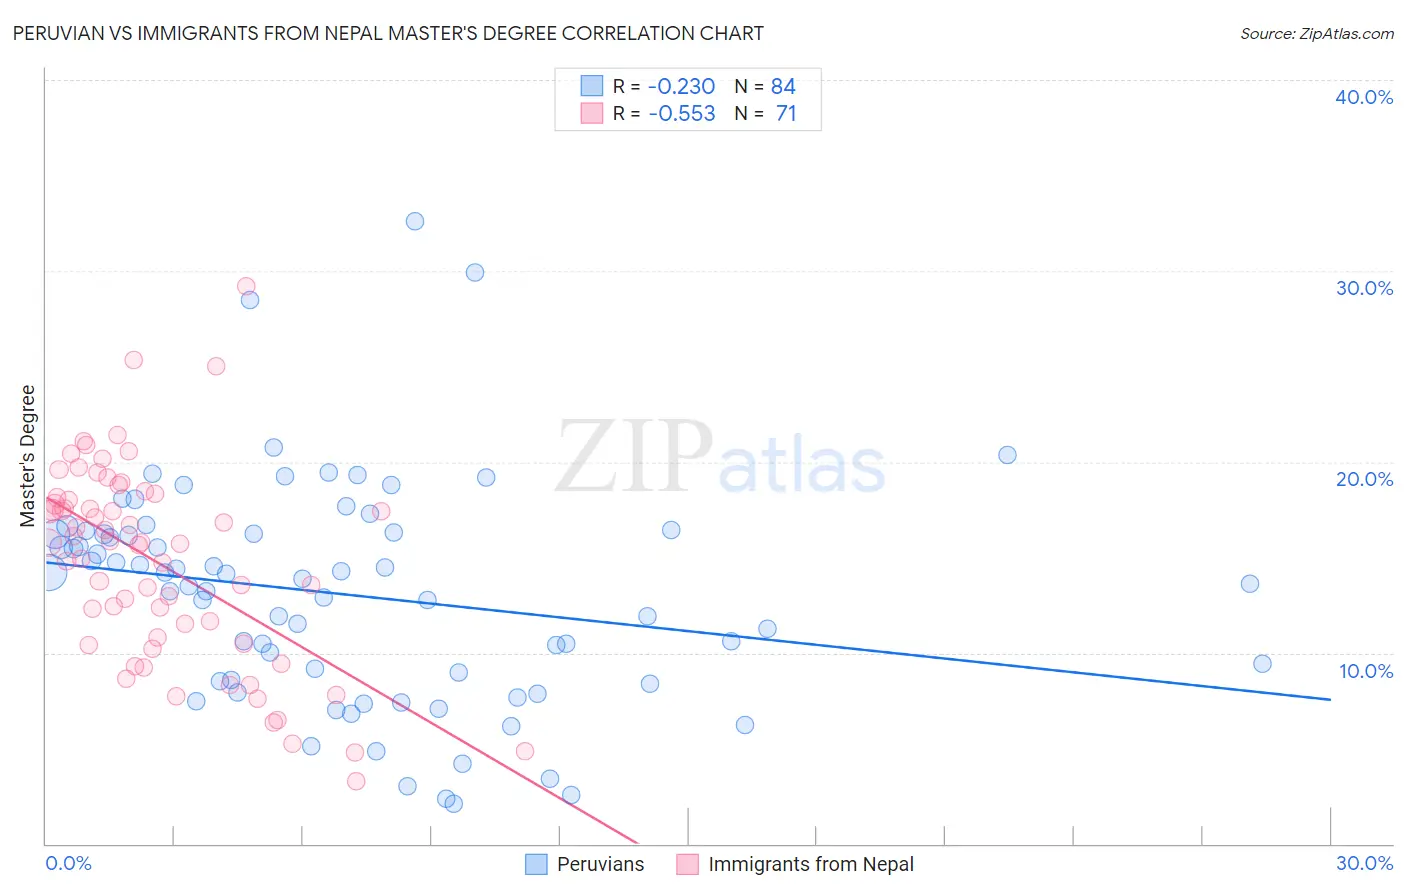
Peruvian vs Immigrants from Nepal Master's Degree Correlation Chart
The statistical analysis conducted on geographies consisting of 363,142,286 people shows a weak negative correlation between the proportion of Peruvians and percentage of population with at least master's degree education in the United States with a correlation coefficient (R) of -0.230 and weighted average of 15.3%. Similarly, the statistical analysis conducted on geographies consisting of 186,748,822 people shows a substantial negative correlation between the proportion of Immigrants from Nepal and percentage of population with at least master's degree education in the United States with a correlation coefficient (R) of -0.553 and weighted average of 17.0%, a difference of 10.8%.
Master's Degree Correlation Summary
| Measurement | Peruvian | Immigrants from Nepal |
| Minimum | 2.1% | 3.3% |
| Maximum | 32.6% | 29.2% |
| Range | 30.5% | 25.9% |
| Mean | 13.1% | 14.7% |
| Median | 13.8% | 15.8% |
| Interquartile 25% (IQ1) | 8.6% | 10.5% |
| Interquartile 75% (IQ3) | 16.3% | 18.1% |
| Interquartile Range (IQR) | 7.7% | 7.6% |
| Standard Deviation (Sample) | 5.8% | 5.3% |
| Standard Deviation (Population) | 5.8% | 5.2% |
Similar Demographics by Master's Degree
Demographics Similar to Peruvians by Master's Degree
In terms of master's degree, the demographic groups most similar to Peruvians are Sudanese (15.3%, a difference of 0.010%), Uruguayan (15.3%, a difference of 0.22%), Kenyan (15.3%, a difference of 0.24%), Colombian (15.3%, a difference of 0.25%), and Immigrants from Kenya (15.3%, a difference of 0.29%).
| Demographics | Rating | Rank | Master's Degree |
| Immigrants | Bangladesh | 76.1 /100 | #155 | Good 15.5% |
| Bermudans | 73.9 /100 | #156 | Good 15.4% |
| Immigrants | Cameroon | 71.7 /100 | #157 | Good 15.4% |
| Immigrants | Poland | 71.5 /100 | #158 | Good 15.4% |
| Luxembourgers | 71.0 /100 | #159 | Good 15.3% |
| Kenyans | 70.3 /100 | #160 | Good 15.3% |
| Sudanese | 68.7 /100 | #161 | Good 15.3% |
| Peruvians | 68.7 /100 | #162 | Good 15.3% |
| Uruguayans | 67.1 /100 | #163 | Good 15.3% |
| Colombians | 66.9 /100 | #164 | Good 15.3% |
| Immigrants | Kenya | 66.6 /100 | #165 | Good 15.3% |
| Swedes | 66.1 /100 | #166 | Good 15.2% |
| Senegalese | 65.6 /100 | #167 | Good 15.2% |
| Immigrants | North Macedonia | 64.5 /100 | #168 | Good 15.2% |
| Scottish | 62.7 /100 | #169 | Good 15.2% |
Demographics Similar to Immigrants from Nepal by Master's Degree
In terms of master's degree, the demographic groups most similar to Immigrants from Nepal are Chilean (16.9%, a difference of 0.080%), Albanian (17.0%, a difference of 0.18%), Laotian (17.0%, a difference of 0.39%), Alsatian (16.9%, a difference of 0.41%), and Immigrants from Ukraine (17.0%, a difference of 0.45%).
| Demographics | Rating | Rank | Master's Degree |
| Ugandans | 99.0 /100 | #94 | Exceptional 17.1% |
| Immigrants | Morocco | 98.9 /100 | #95 | Exceptional 17.1% |
| Immigrants | Northern Africa | 98.9 /100 | #96 | Exceptional 17.1% |
| Immigrants | England | 98.8 /100 | #97 | Exceptional 17.0% |
| Immigrants | Ukraine | 98.8 /100 | #98 | Exceptional 17.0% |
| Laotians | 98.8 /100 | #99 | Exceptional 17.0% |
| Albanians | 98.7 /100 | #100 | Exceptional 17.0% |
| Immigrants | Nepal | 98.6 /100 | #101 | Exceptional 17.0% |
| Chileans | 98.6 /100 | #102 | Exceptional 16.9% |
| Alsatians | 98.4 /100 | #103 | Exceptional 16.9% |
| Ukrainians | 98.3 /100 | #104 | Exceptional 16.9% |
| Syrians | 98.3 /100 | #105 | Exceptional 16.8% |
| Immigrants | Albania | 98.1 /100 | #106 | Exceptional 16.8% |
| Armenians | 98.0 /100 | #107 | Exceptional 16.8% |
| Sierra Leoneans | 98.0 /100 | #108 | Exceptional 16.8% |