Peruvian vs Immigrants from Nepal Nursery School
COMPARE
Peruvian
Immigrants from Nepal
Nursery School
Nursery School Comparison
Peruvians
Immigrants from Nepal
97.6%
NURSERY SCHOOL
1.0/ 100
METRIC RATING
246th/ 347
METRIC RANK
97.7%
NURSERY SCHOOL
3.6/ 100
METRIC RATING
224th/ 347
METRIC RANK
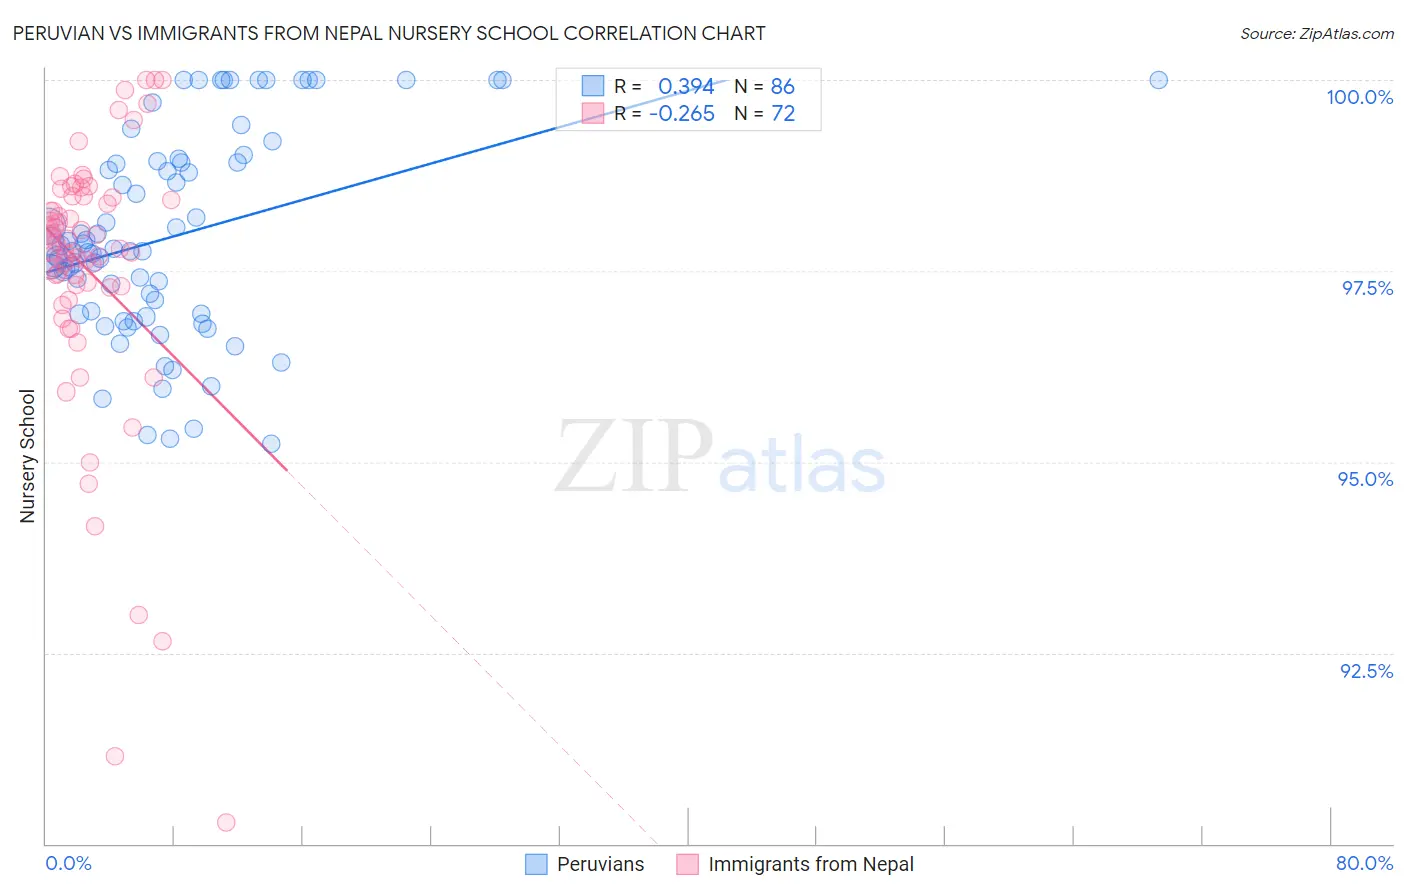
Peruvian vs Immigrants from Nepal Nursery School Correlation Chart
The statistical analysis conducted on geographies consisting of 363,068,462 people shows a mild positive correlation between the proportion of Peruvians and percentage of population with at least nursery school education in the United States with a correlation coefficient (R) of 0.394 and weighted average of 97.6%. Similarly, the statistical analysis conducted on geographies consisting of 186,766,254 people shows a weak negative correlation between the proportion of Immigrants from Nepal and percentage of population with at least nursery school education in the United States with a correlation coefficient (R) of -0.265 and weighted average of 97.7%, a difference of 0.10%.
Nursery School Correlation Summary
| Measurement | Peruvian | Immigrants from Nepal |
| Minimum | 95.2% | 90.3% |
| Maximum | 100.0% | 100.0% |
| Range | 4.8% | 9.7% |
| Mean | 98.0% | 97.5% |
| Median | 97.8% | 97.8% |
| Interquartile 25% (IQ1) | 96.9% | 97.3% |
| Interquartile 75% (IQ3) | 98.9% | 98.5% |
| Interquartile Range (IQR) | 2.0% | 1.2% |
| Standard Deviation (Sample) | 1.3% | 1.8% |
| Standard Deviation (Population) | 1.3% | 1.8% |
Similar Demographics by Nursery School
Demographics Similar to Peruvians by Nursery School
In terms of nursery school, the demographic groups most similar to Peruvians are South American (97.6%, a difference of 0.0%), Bolivian (97.6%, a difference of 0.0%), Immigrants from Middle Africa (97.6%, a difference of 0.0%), Indian (Asian) (97.6%, a difference of 0.0%), and Immigrants from Indonesia (97.7%, a difference of 0.010%).
| Demographics | Rating | Rank | Nursery School |
| Immigrants | Eastern Asia | 1.6 /100 | #239 | Tragic 97.7% |
| Koreans | 1.4 /100 | #240 | Tragic 97.7% |
| Immigrants | Indonesia | 1.1 /100 | #241 | Tragic 97.7% |
| Liberians | 1.1 /100 | #242 | Tragic 97.7% |
| Asians | 1.1 /100 | #243 | Tragic 97.6% |
| South Americans | 1.0 /100 | #244 | Tragic 97.6% |
| Bolivians | 1.0 /100 | #245 | Tragic 97.6% |
| Peruvians | 1.0 /100 | #246 | Tragic 97.6% |
| Immigrants | Middle Africa | 0.9 /100 | #247 | Tragic 97.6% |
| Indians (Asian) | 0.9 /100 | #248 | Tragic 97.6% |
| Immigrants | Eastern Africa | 0.9 /100 | #249 | Tragic 97.6% |
| Immigrants | Senegal | 0.9 /100 | #250 | Tragic 97.6% |
| Ethiopians | 0.8 /100 | #251 | Tragic 97.6% |
| Immigrants | Africa | 0.8 /100 | #252 | Tragic 97.6% |
| Immigrants | Iraq | 0.7 /100 | #253 | Tragic 97.6% |
Demographics Similar to Immigrants from Nepal by Nursery School
In terms of nursery school, the demographic groups most similar to Immigrants from Nepal are Immigrants from Costa Rica (97.7%, a difference of 0.0%), Iraqi (97.7%, a difference of 0.0%), Immigrants from Zaire (97.8%, a difference of 0.010%), Tongan (97.8%, a difference of 0.010%), and Immigrants from Syria (97.7%, a difference of 0.010%).
| Demographics | Rating | Rank | Nursery School |
| Samoans | 6.3 /100 | #217 | Tragic 97.8% |
| Immigrants | Panama | 5.3 /100 | #218 | Tragic 97.8% |
| Immigrants | Morocco | 5.1 /100 | #219 | Tragic 97.8% |
| Immigrants | Zaire | 4.4 /100 | #220 | Tragic 97.8% |
| Tongans | 4.3 /100 | #221 | Tragic 97.8% |
| Immigrants | Syria | 4.0 /100 | #222 | Tragic 97.7% |
| Immigrants | Sudan | 3.9 /100 | #223 | Tragic 97.7% |
| Immigrants | Nepal | 3.6 /100 | #224 | Tragic 97.7% |
| Immigrants | Costa Rica | 3.5 /100 | #225 | Tragic 97.7% |
| Iraqis | 3.5 /100 | #226 | Tragic 97.7% |
| Sub-Saharan Africans | 3.2 /100 | #227 | Tragic 97.7% |
| Sudanese | 3.2 /100 | #228 | Tragic 97.7% |
| Senegalese | 3.2 /100 | #229 | Tragic 97.7% |
| Sierra Leoneans | 2.9 /100 | #230 | Tragic 97.7% |
| Puerto Ricans | 2.6 /100 | #231 | Tragic 97.7% |