Albanian vs Immigrants from Nepal Currently Married
COMPARE
Albanian
Immigrants from Nepal
Currently Married
Currently Married Comparison
Albanians
Immigrants from Nepal
47.0%
CURRENTLY MARRIED
68.6/ 100
METRIC RATING
154th/ 347
METRIC RANK
46.1%
CURRENTLY MARRIED
23.7/ 100
METRIC RATING
195th/ 347
METRIC RANK
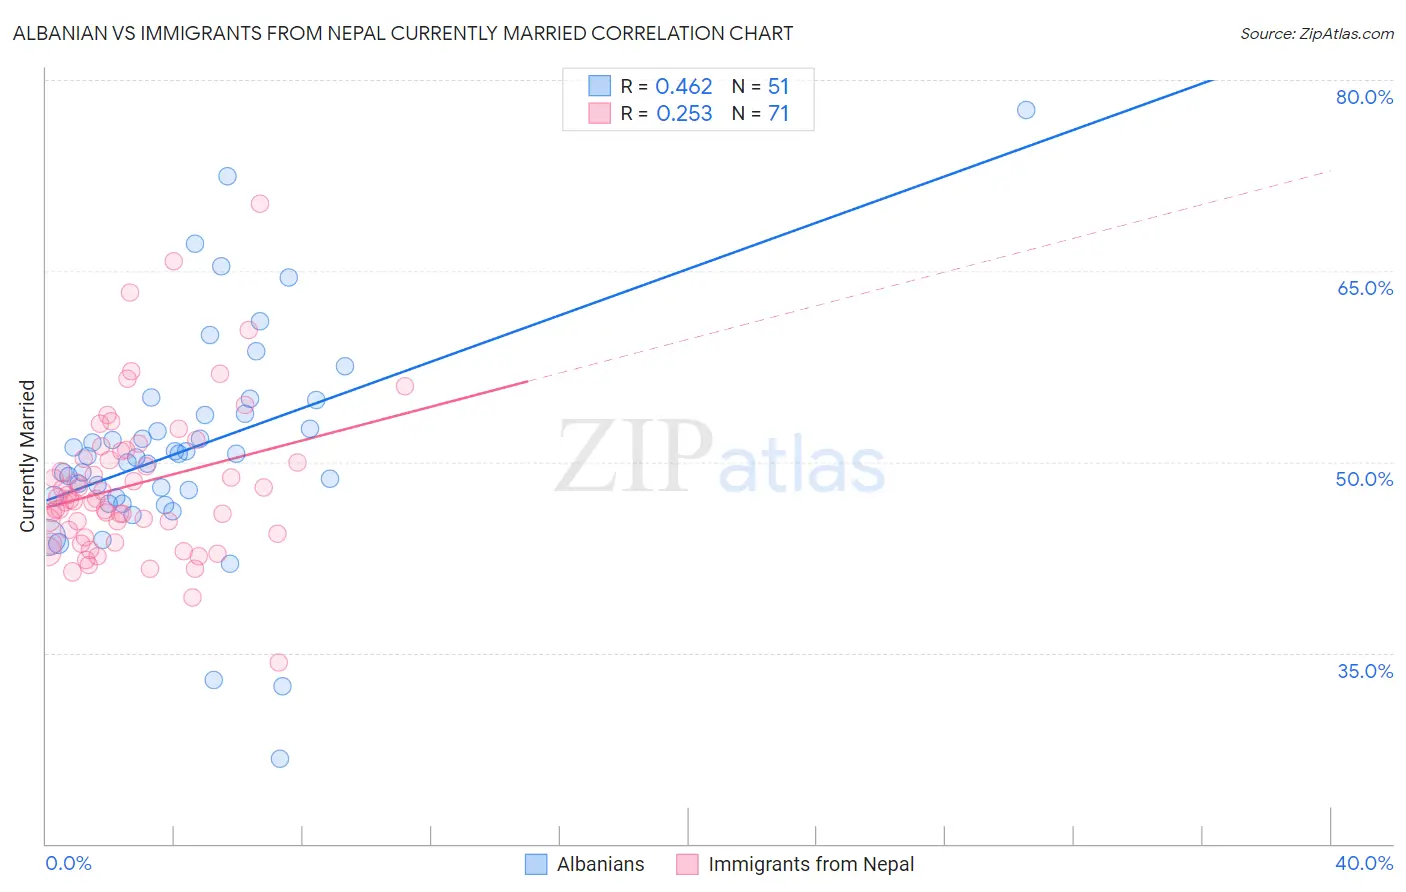
Albanian vs Immigrants from Nepal Currently Married Correlation Chart
The statistical analysis conducted on geographies consisting of 193,235,745 people shows a moderate positive correlation between the proportion of Albanians and percentage of population currently married in the United States with a correlation coefficient (R) of 0.462 and weighted average of 47.0%. Similarly, the statistical analysis conducted on geographies consisting of 186,760,153 people shows a weak positive correlation between the proportion of Immigrants from Nepal and percentage of population currently married in the United States with a correlation coefficient (R) of 0.253 and weighted average of 46.1%, a difference of 1.8%.
Currently Married Correlation Summary
| Measurement | Albanian | Immigrants from Nepal |
| Minimum | 26.7% | 34.2% |
| Maximum | 77.6% | 70.3% |
| Range | 50.9% | 36.1% |
| Mean | 51.0% | 48.2% |
| Median | 50.5% | 47.1% |
| Interquartile 25% (IQ1) | 47.2% | 44.4% |
| Interquartile 75% (IQ3) | 53.7% | 50.8% |
| Interquartile Range (IQR) | 6.5% | 6.4% |
| Standard Deviation (Sample) | 8.8% | 6.0% |
| Standard Deviation (Population) | 8.7% | 5.9% |
Similar Demographics by Currently Married
Demographics Similar to Albanians by Currently Married
In terms of currently married, the demographic groups most similar to Albanians are Immigrants from Venezuela (47.0%, a difference of 0.0%), Arab (47.0%, a difference of 0.0%), Immigrants from Serbia (47.0%, a difference of 0.010%), Spanish (47.0%, a difference of 0.020%), and Immigrants from Switzerland (46.9%, a difference of 0.030%).
| Demographics | Rating | Rank | Currently Married |
| Immigrants | Argentina | 72.0 /100 | #147 | Good 47.0% |
| Cambodians | 70.4 /100 | #148 | Good 47.0% |
| Zimbabweans | 70.1 /100 | #149 | Good 47.0% |
| Immigrants | Turkey | 70.0 /100 | #150 | Good 47.0% |
| Chileans | 69.8 /100 | #151 | Good 47.0% |
| Immigrants | Serbia | 68.8 /100 | #152 | Good 47.0% |
| Immigrants | Venezuela | 68.6 /100 | #153 | Good 47.0% |
| Albanians | 68.6 /100 | #154 | Good 47.0% |
| Arabs | 68.6 /100 | #155 | Good 47.0% |
| Spanish | 68.1 /100 | #156 | Good 47.0% |
| Immigrants | Switzerland | 67.8 /100 | #157 | Good 46.9% |
| Cherokee | 66.8 /100 | #158 | Good 46.9% |
| Iraqis | 66.4 /100 | #159 | Good 46.9% |
| Immigrants | Uzbekistan | 66.0 /100 | #160 | Good 46.9% |
| Immigrants | Southern Europe | 65.9 /100 | #161 | Good 46.9% |
Demographics Similar to Immigrants from Nepal by Currently Married
In terms of currently married, the demographic groups most similar to Immigrants from Nepal are South American (46.1%, a difference of 0.010%), Immigrants from Fiji (46.2%, a difference of 0.070%), Immigrants from Bosnia and Herzegovina (46.1%, a difference of 0.070%), Soviet Union (46.2%, a difference of 0.10%), and Immigrants from Kuwait (46.1%, a difference of 0.10%).
| Demographics | Rating | Rank | Currently Married |
| Colombians | 31.8 /100 | #188 | Fair 46.3% |
| Fijians | 30.3 /100 | #189 | Fair 46.3% |
| Choctaw | 29.1 /100 | #190 | Fair 46.3% |
| Immigrants | France | 27.7 /100 | #191 | Fair 46.2% |
| Soviet Union | 25.7 /100 | #192 | Fair 46.2% |
| Immigrants | Fiji | 25.0 /100 | #193 | Fair 46.2% |
| South Americans | 23.8 /100 | #194 | Fair 46.1% |
| Immigrants | Nepal | 23.7 /100 | #195 | Fair 46.1% |
| Immigrants | Bosnia and Herzegovina | 22.2 /100 | #196 | Fair 46.1% |
| Immigrants | Kuwait | 21.7 /100 | #197 | Fair 46.1% |
| Immigrants | Colombia | 21.0 /100 | #198 | Fair 46.1% |
| Immigrants | Costa Rica | 19.6 /100 | #199 | Poor 46.0% |
| Creek | 17.2 /100 | #200 | Poor 46.0% |
| Malaysians | 15.3 /100 | #201 | Poor 45.9% |
| Immigrants | Albania | 14.5 /100 | #202 | Poor 45.9% |