Peruvian vs Immigrants from Nepal College, Under 1 year
COMPARE
Peruvian
Immigrants from Nepal
College, Under 1 year
College, Under 1 year Comparison
Peruvians
Immigrants from Nepal
64.1%
COLLEGE, UNDER 1 YEAR
13.7/ 100
METRIC RATING
205th/ 347
METRIC RANK
67.5%
COLLEGE, UNDER 1 YEAR
94.9/ 100
METRIC RATING
116th/ 347
METRIC RANK
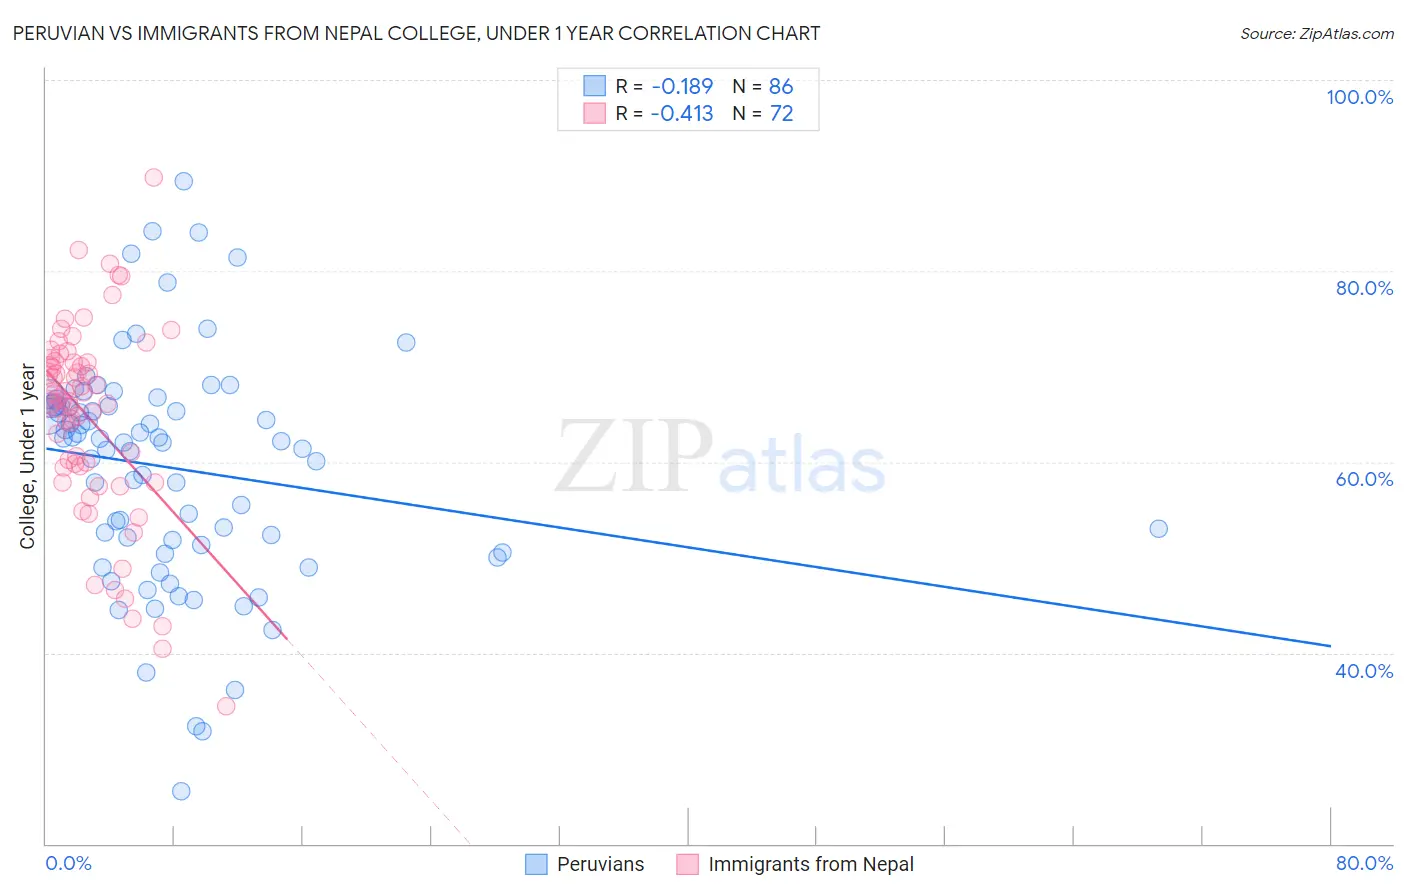
Peruvian vs Immigrants from Nepal College, Under 1 year Correlation Chart
The statistical analysis conducted on geographies consisting of 363,248,867 people shows a poor negative correlation between the proportion of Peruvians and percentage of population with at least college, under 1 year education in the United States with a correlation coefficient (R) of -0.189 and weighted average of 64.1%. Similarly, the statistical analysis conducted on geographies consisting of 186,775,596 people shows a moderate negative correlation between the proportion of Immigrants from Nepal and percentage of population with at least college, under 1 year education in the United States with a correlation coefficient (R) of -0.413 and weighted average of 67.5%, a difference of 5.3%.
College, Under 1 year Correlation Summary
| Measurement | Peruvian | Immigrants from Nepal |
| Minimum | 25.5% | 34.4% |
| Maximum | 89.4% | 89.8% |
| Range | 63.9% | 55.5% |
| Mean | 59.4% | 64.6% |
| Median | 62.1% | 66.3% |
| Interquartile 25% (IQ1) | 51.3% | 59.5% |
| Interquartile 75% (IQ3) | 65.9% | 70.5% |
| Interquartile Range (IQR) | 14.6% | 11.0% |
| Standard Deviation (Sample) | 12.0% | 10.3% |
| Standard Deviation (Population) | 11.9% | 10.2% |
Similar Demographics by College, Under 1 year
Demographics Similar to Peruvians by College, Under 1 year
In terms of college, under 1 year, the demographic groups most similar to Peruvians are Immigrants from Zaire (64.1%, a difference of 0.080%), White/Caucasian (64.0%, a difference of 0.090%), Colombian (64.0%, a difference of 0.13%), Immigrants from Vietnam (64.0%, a difference of 0.16%), and Uruguayan (64.2%, a difference of 0.17%).
| Demographics | Rating | Rank | College, Under 1 year |
| Tsimshian | 17.9 /100 | #198 | Poor 64.3% |
| Panamanians | 17.0 /100 | #199 | Poor 64.3% |
| Nigerians | 16.7 /100 | #200 | Poor 64.3% |
| French Canadians | 16.3 /100 | #201 | Poor 64.2% |
| South Americans | 16.2 /100 | #202 | Poor 64.2% |
| Uruguayans | 15.6 /100 | #203 | Poor 64.2% |
| Immigrants | Zaire | 14.6 /100 | #204 | Poor 64.1% |
| Peruvians | 13.7 /100 | #205 | Poor 64.1% |
| Whites/Caucasians | 12.8 /100 | #206 | Poor 64.0% |
| Colombians | 12.4 /100 | #207 | Poor 64.0% |
| Immigrants | Vietnam | 12.1 /100 | #208 | Poor 64.0% |
| Puget Sound Salish | 11.3 /100 | #209 | Poor 63.9% |
| Ghanaians | 11.2 /100 | #210 | Poor 63.9% |
| Native Hawaiians | 10.6 /100 | #211 | Poor 63.9% |
| Immigrants | Middle Africa | 10.5 /100 | #212 | Poor 63.9% |
Demographics Similar to Immigrants from Nepal by College, Under 1 year
In terms of college, under 1 year, the demographic groups most similar to Immigrants from Nepal are Pakistani (67.5%, a difference of 0.020%), Immigrants from Ukraine (67.5%, a difference of 0.040%), Lebanese (67.5%, a difference of 0.060%), Basque (67.6%, a difference of 0.080%), and Chilean (67.6%, a difference of 0.090%).
| Demographics | Rating | Rank | College, Under 1 year |
| Scandinavians | 95.8 /100 | #109 | Exceptional 67.7% |
| Assyrians/Chaldeans/Syriacs | 95.8 /100 | #110 | Exceptional 67.7% |
| Ukrainians | 95.8 /100 | #111 | Exceptional 67.7% |
| Macedonians | 95.7 /100 | #112 | Exceptional 67.6% |
| Syrians | 95.6 /100 | #113 | Exceptional 67.6% |
| Chileans | 95.3 /100 | #114 | Exceptional 67.6% |
| Basques | 95.2 /100 | #115 | Exceptional 67.6% |
| Immigrants | Nepal | 94.9 /100 | #116 | Exceptional 67.5% |
| Pakistanis | 94.8 /100 | #117 | Exceptional 67.5% |
| Immigrants | Ukraine | 94.7 /100 | #118 | Exceptional 67.5% |
| Lebanese | 94.6 /100 | #119 | Exceptional 67.5% |
| Serbians | 93.9 /100 | #120 | Exceptional 67.4% |
| Slovenes | 93.3 /100 | #121 | Exceptional 67.3% |
| Immigrants | Jordan | 92.8 /100 | #122 | Exceptional 67.3% |
| Immigrants | Northern Africa | 92.7 /100 | #123 | Exceptional 67.2% |