Paraguayan vs Potawatomi Married-couple Households
COMPARE
Paraguayan
Potawatomi
Married-couple Households
Married-couple Households Comparison
Paraguayans
Potawatomi
47.0%
MARRIED-COUPLE HOUSEHOLDS
78.7/ 100
METRIC RATING
149th/ 347
METRIC RANK
45.7%
MARRIED-COUPLE HOUSEHOLDS
15.6/ 100
METRIC RATING
200th/ 347
METRIC RANK
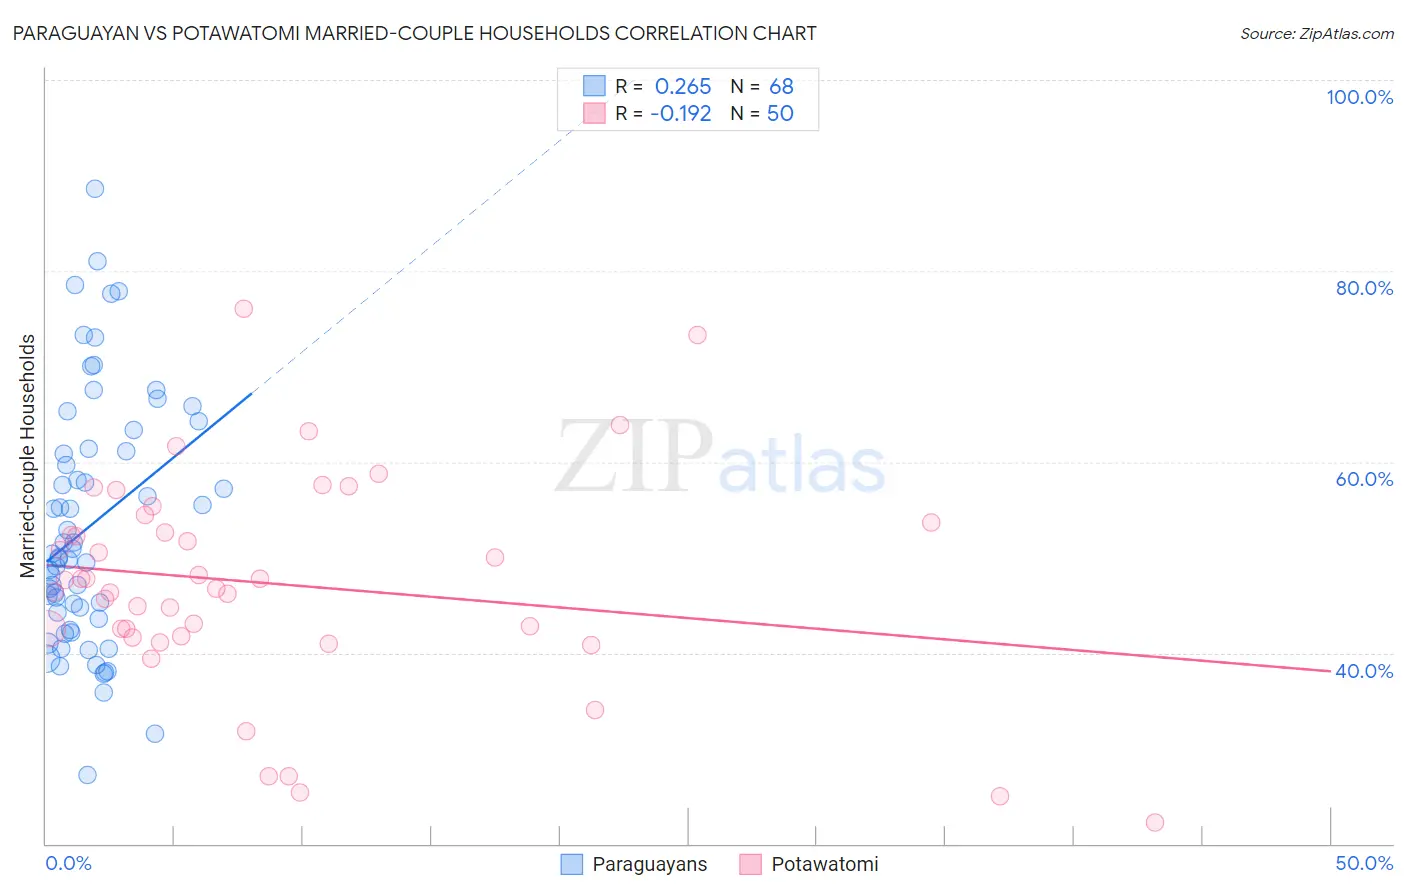
Paraguayan vs Potawatomi Married-couple Households Correlation Chart
The statistical analysis conducted on geographies consisting of 95,096,913 people shows a weak positive correlation between the proportion of Paraguayans and percentage of married-couple family households in the United States with a correlation coefficient (R) of 0.265 and weighted average of 47.0%. Similarly, the statistical analysis conducted on geographies consisting of 117,759,864 people shows a poor negative correlation between the proportion of Potawatomi and percentage of married-couple family households in the United States with a correlation coefficient (R) of -0.192 and weighted average of 45.7%, a difference of 2.9%.
Married-couple Households Correlation Summary
| Measurement | Paraguayan | Potawatomi |
| Minimum | 27.2% | 22.2% |
| Maximum | 88.5% | 76.1% |
| Range | 61.4% | 53.9% |
| Mean | 53.2% | 47.2% |
| Median | 50.2% | 47.1% |
| Interquartile 25% (IQ1) | 43.9% | 41.8% |
| Interquartile 75% (IQ3) | 61.2% | 53.7% |
| Interquartile Range (IQR) | 17.3% | 11.9% |
| Standard Deviation (Sample) | 12.9% | 11.3% |
| Standard Deviation (Population) | 12.8% | 11.2% |
Similar Demographics by Married-couple Households
Demographics Similar to Paraguayans by Married-couple Households
In terms of married-couple households, the demographic groups most similar to Paraguayans are Icelander (47.0%, a difference of 0.050%), Immigrants from Russia (47.0%, a difference of 0.060%), Immigrants from Bulgaria (47.0%, a difference of 0.10%), Serbian (47.0%, a difference of 0.12%), and Hmong (47.0%, a difference of 0.13%).
| Demographics | Rating | Rank | Married-couple Households |
| Spaniards | 84.1 /100 | #142 | Excellent 47.2% |
| Immigrants | Belarus | 83.8 /100 | #143 | Excellent 47.2% |
| Mexicans | 83.4 /100 | #144 | Excellent 47.1% |
| Slovenes | 81.7 /100 | #145 | Excellent 47.1% |
| Immigrants | Western Europe | 81.6 /100 | #146 | Excellent 47.1% |
| Immigrants | Syria | 81.6 /100 | #147 | Excellent 47.1% |
| Icelanders | 79.5 /100 | #148 | Good 47.0% |
| Paraguayans | 78.7 /100 | #149 | Good 47.0% |
| Immigrants | Russia | 77.6 /100 | #150 | Good 47.0% |
| Immigrants | Bulgaria | 76.8 /100 | #151 | Good 47.0% |
| Serbians | 76.3 /100 | #152 | Good 47.0% |
| Hmong | 76.2 /100 | #153 | Good 47.0% |
| Immigrants | Western Asia | 76.1 /100 | #154 | Good 46.9% |
| Arabs | 76.0 /100 | #155 | Good 46.9% |
| Armenians | 75.4 /100 | #156 | Good 46.9% |
Demographics Similar to Potawatomi by Married-couple Households
In terms of married-couple households, the demographic groups most similar to Potawatomi are Carpatho Rusyn (45.7%, a difference of 0.010%), Immigrants from Serbia (45.7%, a difference of 0.030%), Immigrants from Central America (45.7%, a difference of 0.11%), Alaska Native (45.6%, a difference of 0.20%), and Ottawa (45.8%, a difference of 0.25%).
| Demographics | Rating | Rank | Married-couple Households |
| Taiwanese | 23.4 /100 | #193 | Fair 45.9% |
| Mexican American Indians | 23.3 /100 | #194 | Fair 45.9% |
| Chickasaw | 22.7 /100 | #195 | Fair 45.9% |
| Immigrants | South America | 22.2 /100 | #196 | Fair 45.9% |
| Cambodians | 21.3 /100 | #197 | Fair 45.9% |
| Ottawa | 19.4 /100 | #198 | Poor 45.8% |
| Carpatho Rusyns | 15.7 /100 | #199 | Poor 45.7% |
| Potawatomi | 15.6 /100 | #200 | Poor 45.7% |
| Immigrants | Serbia | 15.2 /100 | #201 | Poor 45.7% |
| Immigrants | Central America | 14.2 /100 | #202 | Poor 45.7% |
| Alaska Natives | 13.0 /100 | #203 | Poor 45.6% |
| Aleuts | 12.5 /100 | #204 | Poor 45.6% |
| Nepalese | 11.9 /100 | #205 | Poor 45.6% |
| Uruguayans | 10.4 /100 | #206 | Poor 45.5% |
| Immigrants | France | 8.8 /100 | #207 | Tragic 45.4% |